Immigrants from Western Europe vs Somali Married-couple Households
COMPARE
Immigrants from Western Europe
Somali
Married-couple Households
Married-couple Households Comparison
Immigrants from Western Europe
Somalis
47.1%
MARRIED-COUPLE HOUSEHOLDS
81.6/ 100
METRIC RATING
146th/ 347
METRIC RANK
39.0%
MARRIED-COUPLE HOUSEHOLDS
0.0/ 100
METRIC RATING
332nd/ 347
METRIC RANK
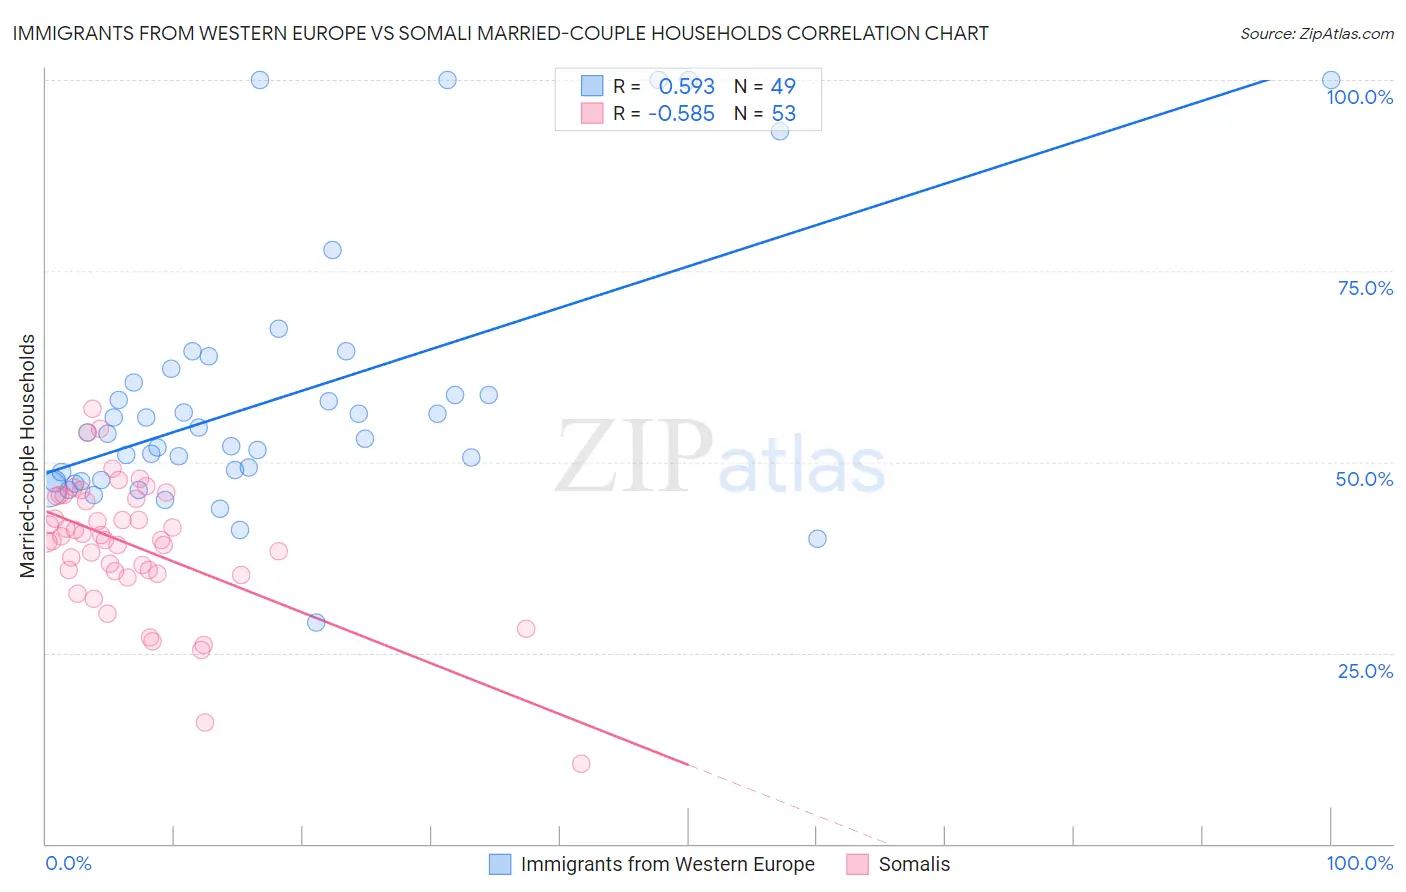
Immigrants from Western Europe vs Somali Married-couple Households Correlation Chart
The statistical analysis conducted on geographies consisting of 493,807,996 people shows a substantial positive correlation between the proportion of Immigrants from Western Europe and percentage of married-couple family households in the United States with a correlation coefficient (R) of 0.593 and weighted average of 47.1%. Similarly, the statistical analysis conducted on geographies consisting of 99,290,778 people shows a substantial negative correlation between the proportion of Somalis and percentage of married-couple family households in the United States with a correlation coefficient (R) of -0.585 and weighted average of 39.0%, a difference of 20.8%.
Married-couple Households Correlation Summary
| Measurement | Immigrants from Western Europe | Somali |
| Minimum | 29.0% | 10.5% |
| Maximum | 100.0% | 57.0% |
| Range | 71.0% | 46.6% |
| Mean | 58.4% | 39.1% |
| Median | 53.7% | 39.8% |
| Interquartile 25% (IQ1) | 47.6% | 35.5% |
| Interquartile 75% (IQ3) | 61.3% | 45.3% |
| Interquartile Range (IQR) | 13.7% | 9.8% |
| Standard Deviation (Sample) | 17.2% | 8.7% |
| Standard Deviation (Population) | 17.0% | 8.6% |
Similar Demographics by Married-couple Households
Demographics Similar to Immigrants from Western Europe by Married-couple Households
In terms of married-couple households, the demographic groups most similar to Immigrants from Western Europe are Slovene (47.1%, a difference of 0.0%), Immigrants from Syria (47.1%, a difference of 0.0%), Mexican (47.1%, a difference of 0.12%), Icelander (47.0%, a difference of 0.13%), and Immigrants from Belarus (47.2%, a difference of 0.14%).
| Demographics | Rating | Rank | Married-couple Households |
| Immigrants | Sweden | 84.7 /100 | #139 | Excellent 47.2% |
| Spanish | 84.5 /100 | #140 | Excellent 47.2% |
| Costa Ricans | 84.4 /100 | #141 | Excellent 47.2% |
| Spaniards | 84.1 /100 | #142 | Excellent 47.2% |
| Immigrants | Belarus | 83.8 /100 | #143 | Excellent 47.2% |
| Mexicans | 83.4 /100 | #144 | Excellent 47.1% |
| Slovenes | 81.7 /100 | #145 | Excellent 47.1% |
| Immigrants | Western Europe | 81.6 /100 | #146 | Excellent 47.1% |
| Immigrants | Syria | 81.6 /100 | #147 | Excellent 47.1% |
| Icelanders | 79.5 /100 | #148 | Good 47.0% |
| Paraguayans | 78.7 /100 | #149 | Good 47.0% |
| Immigrants | Russia | 77.6 /100 | #150 | Good 47.0% |
| Immigrants | Bulgaria | 76.8 /100 | #151 | Good 47.0% |
| Serbians | 76.3 /100 | #152 | Good 47.0% |
| Hmong | 76.2 /100 | #153 | Good 47.0% |
Demographics Similar to Somalis by Married-couple Households
In terms of married-couple households, the demographic groups most similar to Somalis are Immigrants from West Indies (39.0%, a difference of 0.030%), Immigrants from Congo (39.0%, a difference of 0.090%), Immigrants from Barbados (39.2%, a difference of 0.52%), Immigrants from St. Vincent and the Grenadines (38.7%, a difference of 0.81%), and Immigrants from Dominica (39.4%, a difference of 0.96%).
| Demographics | Rating | Rank | Married-couple Households |
| Pueblo | 0.0 /100 | #325 | Tragic 40.0% |
| U.S. Virgin Islanders | 0.0 /100 | #326 | Tragic 39.8% |
| Lumbee | 0.0 /100 | #327 | Tragic 39.6% |
| Barbadians | 0.0 /100 | #328 | Tragic 39.4% |
| Immigrants | Dominica | 0.0 /100 | #329 | Tragic 39.4% |
| Immigrants | Barbados | 0.0 /100 | #330 | Tragic 39.2% |
| Immigrants | Congo | 0.0 /100 | #331 | Tragic 39.0% |
| Somalis | 0.0 /100 | #332 | Tragic 39.0% |
| Immigrants | West Indies | 0.0 /100 | #333 | Tragic 39.0% |
| Immigrants | St. Vincent and the Grenadines | 0.0 /100 | #334 | Tragic 38.7% |
| Senegalese | 0.0 /100 | #335 | Tragic 38.6% |
| Blacks/African Americans | 0.0 /100 | #336 | Tragic 38.5% |
| Immigrants | Somalia | 0.0 /100 | #337 | Tragic 38.4% |
| Immigrants | Senegal | 0.0 /100 | #338 | Tragic 38.4% |
| British West Indians | 0.0 /100 | #339 | Tragic 38.3% |