Macedonian vs Somali Married-couple Households
COMPARE
Macedonian
Somali
Married-couple Households
Married-couple Households Comparison
Macedonians
Somalis
47.6%
MARRIED-COUPLE HOUSEHOLDS
93.9/ 100
METRIC RATING
110th/ 347
METRIC RANK
39.0%
MARRIED-COUPLE HOUSEHOLDS
0.0/ 100
METRIC RATING
332nd/ 347
METRIC RANK
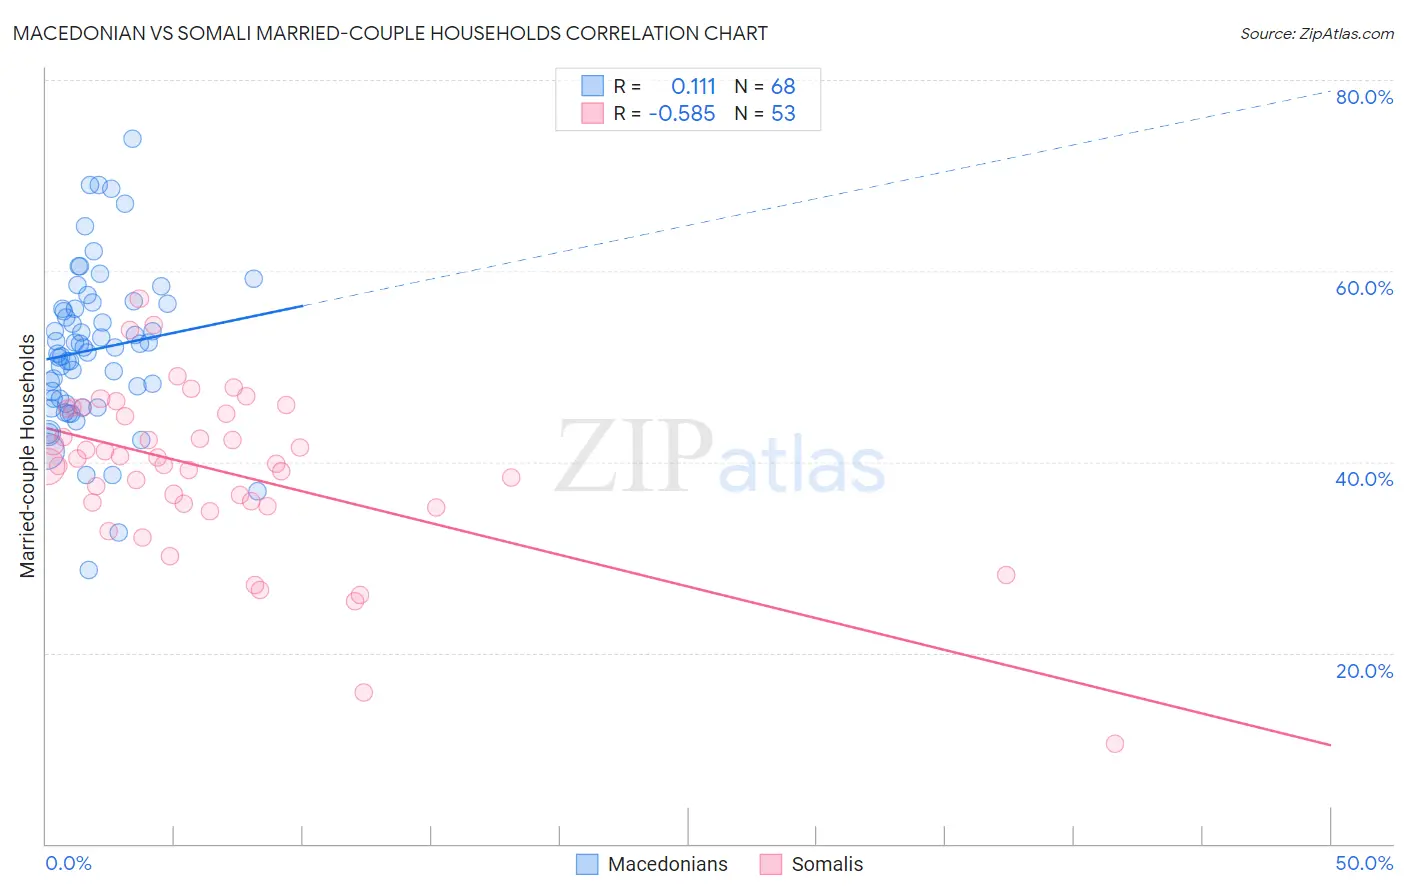
Macedonian vs Somali Married-couple Households Correlation Chart
The statistical analysis conducted on geographies consisting of 132,608,945 people shows a poor positive correlation between the proportion of Macedonians and percentage of married-couple family households in the United States with a correlation coefficient (R) of 0.111 and weighted average of 47.6%. Similarly, the statistical analysis conducted on geographies consisting of 99,290,778 people shows a substantial negative correlation between the proportion of Somalis and percentage of married-couple family households in the United States with a correlation coefficient (R) of -0.585 and weighted average of 39.0%, a difference of 22.2%.
Married-couple Households Correlation Summary
| Measurement | Macedonian | Somali |
| Minimum | 28.7% | 10.5% |
| Maximum | 73.8% | 57.0% |
| Range | 45.2% | 46.6% |
| Mean | 51.8% | 39.1% |
| Median | 52.0% | 39.8% |
| Interquartile 25% (IQ1) | 46.3% | 35.5% |
| Interquartile 75% (IQ3) | 56.3% | 45.3% |
| Interquartile Range (IQR) | 10.0% | 9.8% |
| Standard Deviation (Sample) | 8.4% | 8.7% |
| Standard Deviation (Population) | 8.3% | 8.6% |
Similar Demographics by Married-couple Households
Demographics Similar to Macedonians by Married-couple Households
In terms of married-couple households, the demographic groups most similar to Macedonians are Syrian (47.6%, a difference of 0.0%), Immigrants from Jordan (47.7%, a difference of 0.020%), Peruvian (47.6%, a difference of 0.020%), Venezuelan (47.6%, a difference of 0.030%), and Immigrants from Europe (47.6%, a difference of 0.030%).
| Demographics | Rating | Rank | Married-couple Households |
| Hawaiians | 96.0 /100 | #103 | Exceptional 47.8% |
| Immigrants | South Africa | 96.0 /100 | #104 | Exceptional 47.8% |
| Immigrants | Czechoslovakia | 95.5 /100 | #105 | Exceptional 47.8% |
| Portuguese | 95.5 /100 | #106 | Exceptional 47.8% |
| Estonians | 94.7 /100 | #107 | Exceptional 47.7% |
| Immigrants | Japan | 94.4 /100 | #108 | Exceptional 47.7% |
| Immigrants | Jordan | 94.1 /100 | #109 | Exceptional 47.7% |
| Macedonians | 93.9 /100 | #110 | Exceptional 47.6% |
| Syrians | 93.9 /100 | #111 | Exceptional 47.6% |
| Peruvians | 93.8 /100 | #112 | Exceptional 47.6% |
| Venezuelans | 93.8 /100 | #113 | Exceptional 47.6% |
| Immigrants | Europe | 93.7 /100 | #114 | Exceptional 47.6% |
| Slovaks | 92.9 /100 | #115 | Exceptional 47.6% |
| Argentineans | 92.5 /100 | #116 | Exceptional 47.5% |
| French Canadians | 92.4 /100 | #117 | Exceptional 47.5% |
Demographics Similar to Somalis by Married-couple Households
In terms of married-couple households, the demographic groups most similar to Somalis are Immigrants from West Indies (39.0%, a difference of 0.030%), Immigrants from Congo (39.0%, a difference of 0.090%), Immigrants from Barbados (39.2%, a difference of 0.52%), Immigrants from St. Vincent and the Grenadines (38.7%, a difference of 0.81%), and Immigrants from Dominica (39.4%, a difference of 0.96%).
| Demographics | Rating | Rank | Married-couple Households |
| Pueblo | 0.0 /100 | #325 | Tragic 40.0% |
| U.S. Virgin Islanders | 0.0 /100 | #326 | Tragic 39.8% |
| Lumbee | 0.0 /100 | #327 | Tragic 39.6% |
| Barbadians | 0.0 /100 | #328 | Tragic 39.4% |
| Immigrants | Dominica | 0.0 /100 | #329 | Tragic 39.4% |
| Immigrants | Barbados | 0.0 /100 | #330 | Tragic 39.2% |
| Immigrants | Congo | 0.0 /100 | #331 | Tragic 39.0% |
| Somalis | 0.0 /100 | #332 | Tragic 39.0% |
| Immigrants | West Indies | 0.0 /100 | #333 | Tragic 39.0% |
| Immigrants | St. Vincent and the Grenadines | 0.0 /100 | #334 | Tragic 38.7% |
| Senegalese | 0.0 /100 | #335 | Tragic 38.6% |
| Blacks/African Americans | 0.0 /100 | #336 | Tragic 38.5% |
| Immigrants | Somalia | 0.0 /100 | #337 | Tragic 38.4% |
| Immigrants | Senegal | 0.0 /100 | #338 | Tragic 38.4% |
| British West Indians | 0.0 /100 | #339 | Tragic 38.3% |