Immigrants from Egypt vs Immigrants from Central America Married-couple Households
COMPARE
Immigrants from Egypt
Immigrants from Central America
Married-couple Households
Married-couple Households Comparison
Immigrants from Egypt
Immigrants from Central America
47.9%
MARRIED-COUPLE HOUSEHOLDS
96.6/ 100
METRIC RATING
96th/ 347
METRIC RANK
45.7%
MARRIED-COUPLE HOUSEHOLDS
14.2/ 100
METRIC RATING
202nd/ 347
METRIC RANK
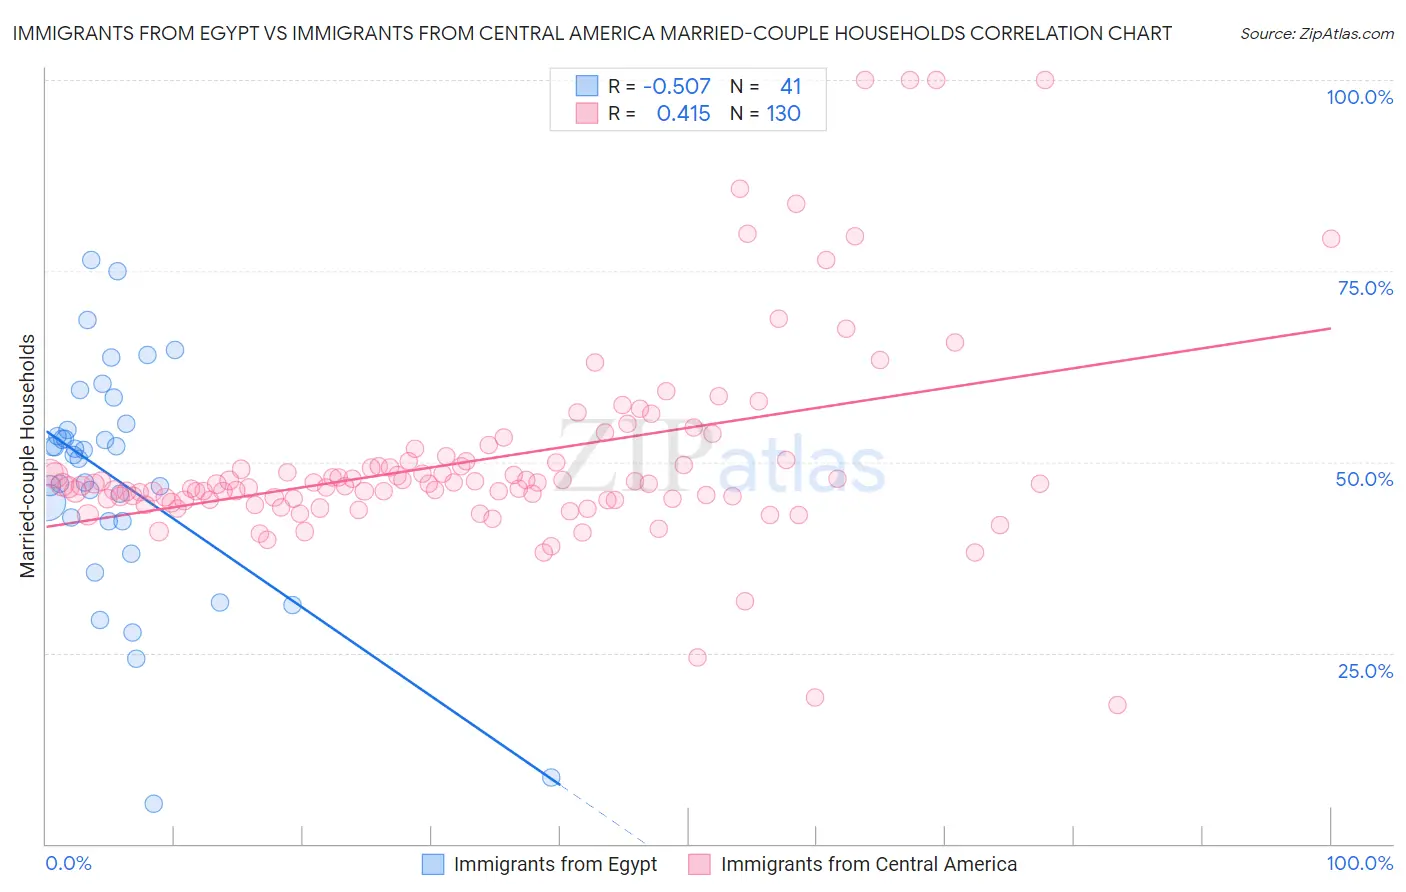
Immigrants from Egypt vs Immigrants from Central America Married-couple Households Correlation Chart
The statistical analysis conducted on geographies consisting of 245,425,004 people shows a substantial negative correlation between the proportion of Immigrants from Egypt and percentage of married-couple family households in the United States with a correlation coefficient (R) of -0.507 and weighted average of 47.9%. Similarly, the statistical analysis conducted on geographies consisting of 536,047,937 people shows a moderate positive correlation between the proportion of Immigrants from Central America and percentage of married-couple family households in the United States with a correlation coefficient (R) of 0.415 and weighted average of 45.7%, a difference of 4.9%.
Married-couple Households Correlation Summary
| Measurement | Immigrants from Egypt | Immigrants from Central America |
| Minimum | 5.3% | 18.2% |
| Maximum | 76.5% | 100.0% |
| Range | 71.2% | 81.8% |
| Mean | 47.7% | 50.3% |
| Median | 51.0% | 47.1% |
| Interquartile 25% (IQ1) | 42.2% | 45.1% |
| Interquartile 75% (IQ3) | 54.6% | 50.1% |
| Interquartile Range (IQR) | 12.3% | 5.0% |
| Standard Deviation (Sample) | 15.0% | 13.3% |
| Standard Deviation (Population) | 14.8% | 13.2% |
Similar Demographics by Married-couple Households
Demographics Similar to Immigrants from Egypt by Married-couple Households
In terms of married-couple households, the demographic groups most similar to Immigrants from Egypt are Latvian (47.9%, a difference of 0.030%), Immigrants from North Macedonia (47.9%, a difference of 0.040%), Immigrants from Belgium (47.9%, a difference of 0.050%), Immigrants from Austria (47.9%, a difference of 0.050%), and Immigrants from Italy (47.9%, a difference of 0.060%).
| Demographics | Rating | Rank | Married-couple Households |
| Cypriots | 97.2 /100 | #89 | Exceptional 48.0% |
| French | 97.2 /100 | #90 | Exceptional 48.0% |
| Immigrants | Moldova | 97.0 /100 | #91 | Exceptional 48.0% |
| Palestinians | 96.9 /100 | #92 | Exceptional 48.0% |
| Lebanese | 96.9 /100 | #93 | Exceptional 47.9% |
| Americans | 96.9 /100 | #94 | Exceptional 47.9% |
| Immigrants | Belgium | 96.8 /100 | #95 | Exceptional 47.9% |
| Immigrants | Egypt | 96.6 /100 | #96 | Exceptional 47.9% |
| Latvians | 96.5 /100 | #97 | Exceptional 47.9% |
| Immigrants | North Macedonia | 96.4 /100 | #98 | Exceptional 47.9% |
| Immigrants | Austria | 96.4 /100 | #99 | Exceptional 47.9% |
| Immigrants | Italy | 96.3 /100 | #100 | Exceptional 47.9% |
| Turks | 96.1 /100 | #101 | Exceptional 47.8% |
| Slavs | 96.0 /100 | #102 | Exceptional 47.8% |
| Hawaiians | 96.0 /100 | #103 | Exceptional 47.8% |
Demographics Similar to Immigrants from Central America by Married-couple Households
In terms of married-couple households, the demographic groups most similar to Immigrants from Central America are Immigrants from Serbia (45.7%, a difference of 0.080%), Alaska Native (45.6%, a difference of 0.090%), Potawatomi (45.7%, a difference of 0.11%), Carpatho Rusyn (45.7%, a difference of 0.12%), and Aleut (45.6%, a difference of 0.14%).
| Demographics | Rating | Rank | Married-couple Households |
| Chickasaw | 22.7 /100 | #195 | Fair 45.9% |
| Immigrants | South America | 22.2 /100 | #196 | Fair 45.9% |
| Cambodians | 21.3 /100 | #197 | Fair 45.9% |
| Ottawa | 19.4 /100 | #198 | Poor 45.8% |
| Carpatho Rusyns | 15.7 /100 | #199 | Poor 45.7% |
| Potawatomi | 15.6 /100 | #200 | Poor 45.7% |
| Immigrants | Serbia | 15.2 /100 | #201 | Poor 45.7% |
| Immigrants | Central America | 14.2 /100 | #202 | Poor 45.7% |
| Alaska Natives | 13.0 /100 | #203 | Poor 45.6% |
| Aleuts | 12.5 /100 | #204 | Poor 45.6% |
| Nepalese | 11.9 /100 | #205 | Poor 45.6% |
| Uruguayans | 10.4 /100 | #206 | Poor 45.5% |
| Immigrants | France | 8.8 /100 | #207 | Tragic 45.4% |
| Hispanics or Latinos | 8.7 /100 | #208 | Tragic 45.4% |
| Immigrants | Uzbekistan | 8.4 /100 | #209 | Tragic 45.4% |