Immigrants from Egypt vs Italian Married-couple Households
COMPARE
Immigrants from Egypt
Italian
Married-couple Households
Married-couple Households Comparison
Immigrants from Egypt
Italians
47.9%
MARRIED-COUPLE HOUSEHOLDS
96.6/ 100
METRIC RATING
96th/ 347
METRIC RANK
49.0%
MARRIED-COUPLE HOUSEHOLDS
99.7/ 100
METRIC RATING
34th/ 347
METRIC RANK
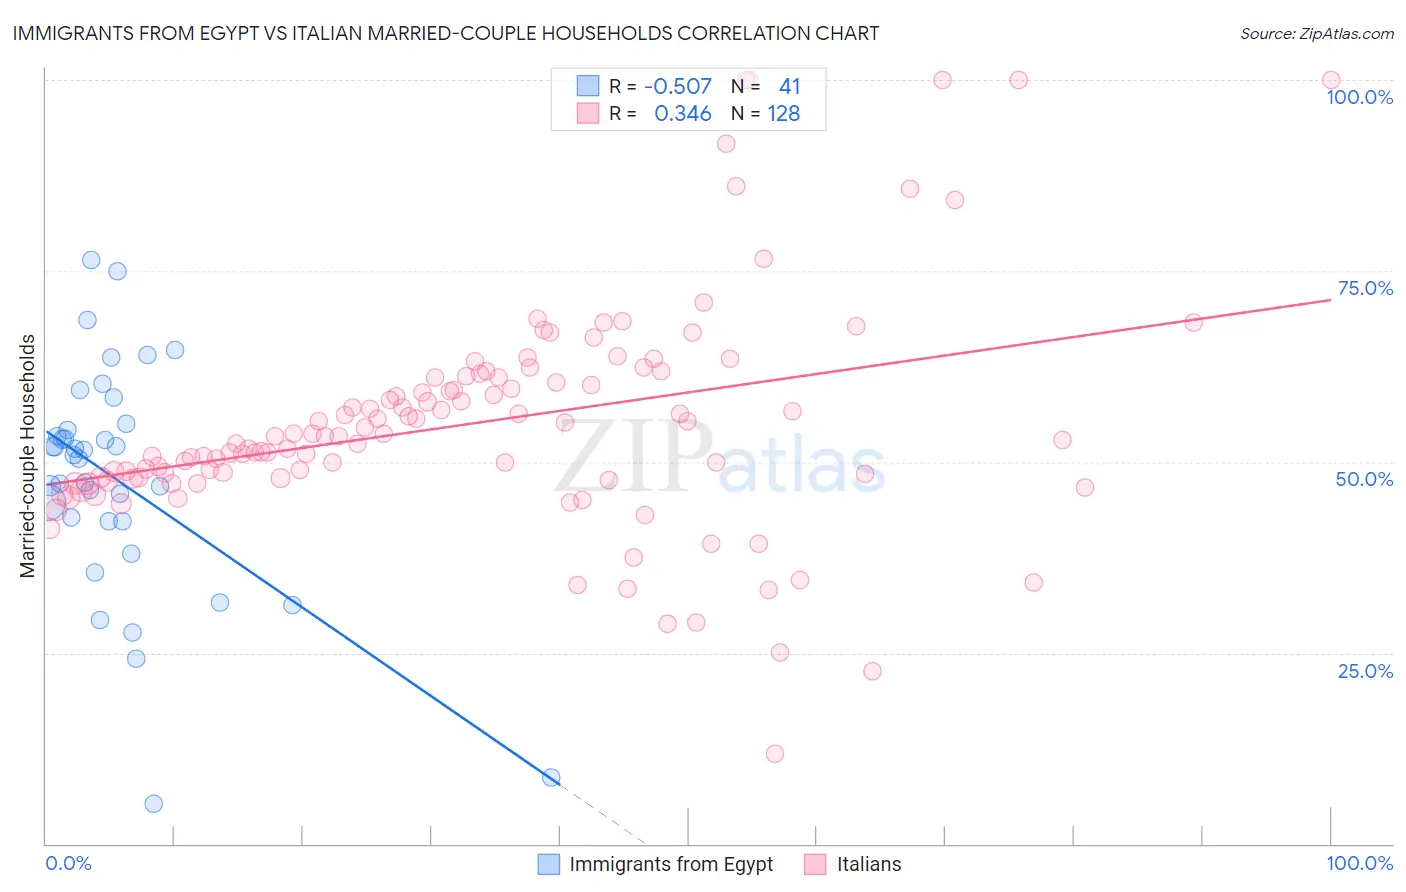
Immigrants from Egypt vs Italian Married-couple Households Correlation Chart
The statistical analysis conducted on geographies consisting of 245,425,004 people shows a substantial negative correlation between the proportion of Immigrants from Egypt and percentage of married-couple family households in the United States with a correlation coefficient (R) of -0.507 and weighted average of 47.9%. Similarly, the statistical analysis conducted on geographies consisting of 574,410,066 people shows a mild positive correlation between the proportion of Italians and percentage of married-couple family households in the United States with a correlation coefficient (R) of 0.346 and weighted average of 49.0%, a difference of 2.3%.
Married-couple Households Correlation Summary
| Measurement | Immigrants from Egypt | Italian |
| Minimum | 5.3% | 11.8% |
| Maximum | 76.5% | 100.0% |
| Range | 71.2% | 88.2% |
| Mean | 47.7% | 55.1% |
| Median | 51.0% | 53.3% |
| Interquartile 25% (IQ1) | 42.2% | 47.9% |
| Interquartile 75% (IQ3) | 54.6% | 61.1% |
| Interquartile Range (IQR) | 12.3% | 13.2% |
| Standard Deviation (Sample) | 15.0% | 14.9% |
| Standard Deviation (Population) | 14.8% | 14.8% |
Similar Demographics by Married-couple Households
Demographics Similar to Immigrants from Egypt by Married-couple Households
In terms of married-couple households, the demographic groups most similar to Immigrants from Egypt are Latvian (47.9%, a difference of 0.030%), Immigrants from North Macedonia (47.9%, a difference of 0.040%), Immigrants from Belgium (47.9%, a difference of 0.050%), Immigrants from Austria (47.9%, a difference of 0.050%), and Immigrants from Italy (47.9%, a difference of 0.060%).
| Demographics | Rating | Rank | Married-couple Households |
| Cypriots | 97.2 /100 | #89 | Exceptional 48.0% |
| French | 97.2 /100 | #90 | Exceptional 48.0% |
| Immigrants | Moldova | 97.0 /100 | #91 | Exceptional 48.0% |
| Palestinians | 96.9 /100 | #92 | Exceptional 48.0% |
| Lebanese | 96.9 /100 | #93 | Exceptional 47.9% |
| Americans | 96.9 /100 | #94 | Exceptional 47.9% |
| Immigrants | Belgium | 96.8 /100 | #95 | Exceptional 47.9% |
| Immigrants | Egypt | 96.6 /100 | #96 | Exceptional 47.9% |
| Latvians | 96.5 /100 | #97 | Exceptional 47.9% |
| Immigrants | North Macedonia | 96.4 /100 | #98 | Exceptional 47.9% |
| Immigrants | Austria | 96.4 /100 | #99 | Exceptional 47.9% |
| Immigrants | Italy | 96.3 /100 | #100 | Exceptional 47.9% |
| Turks | 96.1 /100 | #101 | Exceptional 47.8% |
| Slavs | 96.0 /100 | #102 | Exceptional 47.8% |
| Hawaiians | 96.0 /100 | #103 | Exceptional 47.8% |
Demographics Similar to Italians by Married-couple Households
In terms of married-couple households, the demographic groups most similar to Italians are Scottish (49.0%, a difference of 0.020%), Immigrants from Asia (49.1%, a difference of 0.080%), Hungarian (49.1%, a difference of 0.11%), Iranian (49.0%, a difference of 0.11%), and Sri Lankan (49.0%, a difference of 0.11%).
| Demographics | Rating | Rank | Married-couple Households |
| Bhutanese | 99.8 /100 | #27 | Exceptional 49.3% |
| Germans | 99.8 /100 | #28 | Exceptional 49.2% |
| Maltese | 99.8 /100 | #29 | Exceptional 49.2% |
| Bolivians | 99.8 /100 | #30 | Exceptional 49.2% |
| Native Hawaiians | 99.8 /100 | #31 | Exceptional 49.1% |
| Hungarians | 99.8 /100 | #32 | Exceptional 49.1% |
| Immigrants | Asia | 99.7 /100 | #33 | Exceptional 49.1% |
| Italians | 99.7 /100 | #34 | Exceptional 49.0% |
| Scottish | 99.7 /100 | #35 | Exceptional 49.0% |
| Iranians | 99.7 /100 | #36 | Exceptional 49.0% |
| Sri Lankans | 99.7 /100 | #37 | Exceptional 49.0% |
| Greeks | 99.7 /100 | #38 | Exceptional 48.9% |
| Lithuanians | 99.6 /100 | #39 | Exceptional 48.9% |
| Immigrants | Bolivia | 99.6 /100 | #40 | Exceptional 48.9% |
| Immigrants | Lebanon | 99.6 /100 | #41 | Exceptional 48.9% |