Comanche vs Immigrants from Belize Family Households with Children
COMPARE
Comanche
Immigrants from Belize
Family Households with Children
Family Households with Children Comparison
Comanche
Immigrants from Belize
27.6%
FAMILY HOUSEHOLDS WITH CHILDREN
74.8/ 100
METRIC RATING
155th/ 347
METRIC RANK
27.7%
FAMILY HOUSEHOLDS WITH CHILDREN
85.7/ 100
METRIC RATING
132nd/ 347
METRIC RANK
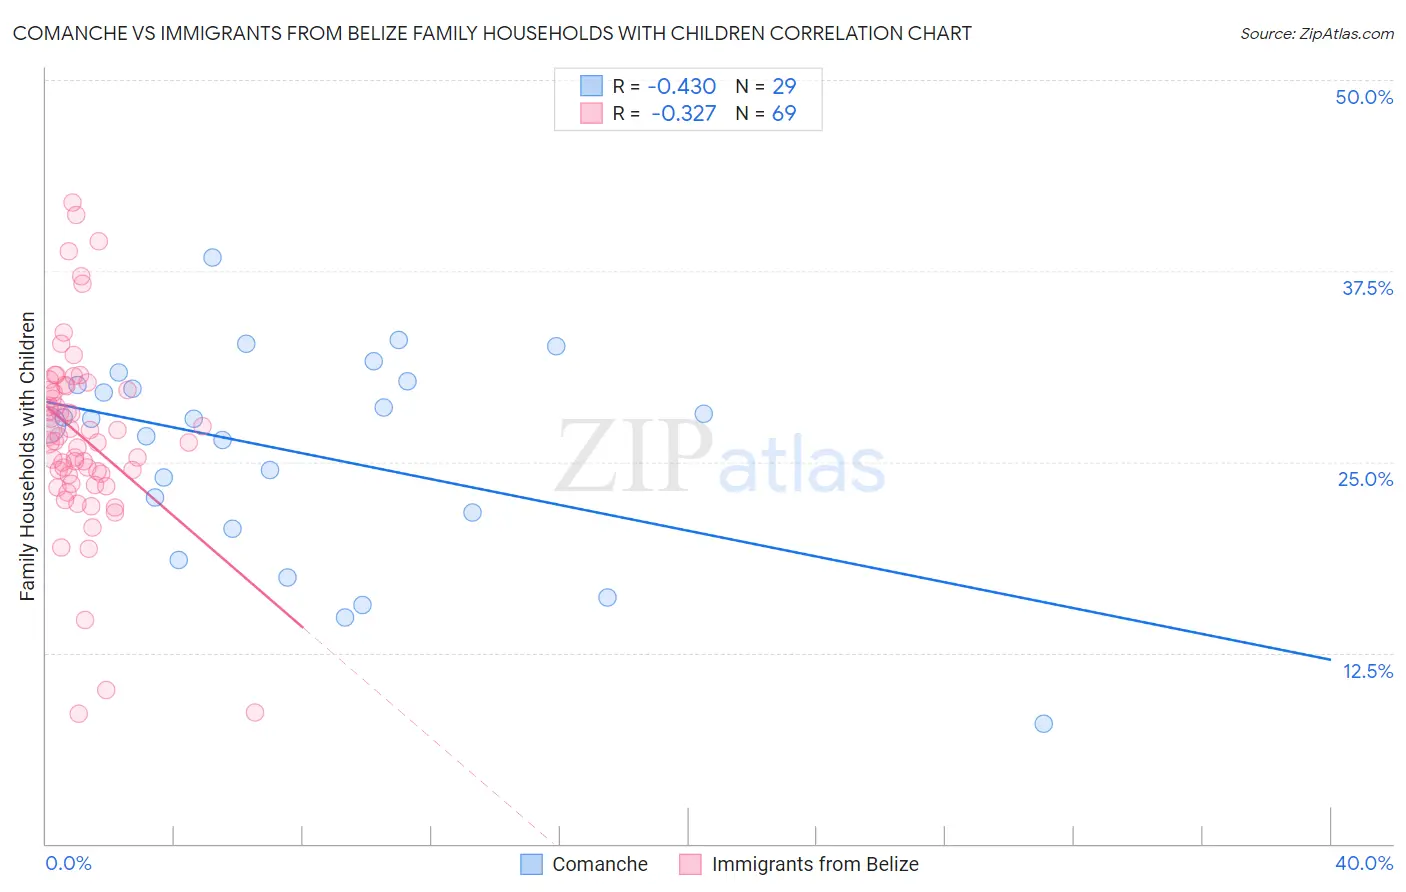
Comanche vs Immigrants from Belize Family Households with Children Correlation Chart
The statistical analysis conducted on geographies consisting of 109,763,732 people shows a moderate negative correlation between the proportion of Comanche and percentage of family households with children in the United States with a correlation coefficient (R) of -0.430 and weighted average of 27.6%. Similarly, the statistical analysis conducted on geographies consisting of 130,285,570 people shows a mild negative correlation between the proportion of Immigrants from Belize and percentage of family households with children in the United States with a correlation coefficient (R) of -0.327 and weighted average of 27.7%, a difference of 0.39%.
Family Households with Children Correlation Summary
| Measurement | Comanche | Immigrants from Belize |
| Minimum | 7.8% | 8.5% |
| Maximum | 38.4% | 42.0% |
| Range | 30.5% | 33.4% |
| Mean | 25.6% | 26.6% |
| Median | 27.8% | 26.4% |
| Interquartile 25% (IQ1) | 21.1% | 23.9% |
| Interquartile 75% (IQ3) | 30.1% | 29.9% |
| Interquartile Range (IQR) | 9.0% | 6.0% |
| Standard Deviation (Sample) | 6.8% | 6.3% |
| Standard Deviation (Population) | 6.6% | 6.2% |
Similar Demographics by Family Households with Children
Demographics Similar to Comanche by Family Households with Children
In terms of family households with children, the demographic groups most similar to Comanche are Icelander (27.6%, a difference of 0.010%), Hungarian (27.6%, a difference of 0.010%), Immigrants from Cabo Verde (27.6%, a difference of 0.020%), Ethiopian (27.6%, a difference of 0.060%), and Portuguese (27.6%, a difference of 0.090%).
| Demographics | Rating | Rank | Family Households with Children |
| Osage | 79.0 /100 | #148 | Good 27.6% |
| Menominee | 78.9 /100 | #149 | Good 27.6% |
| Argentineans | 78.5 /100 | #150 | Good 27.6% |
| Portuguese | 77.8 /100 | #151 | Good 27.6% |
| Ethiopians | 77.0 /100 | #152 | Good 27.6% |
| Immigrants | Cabo Verde | 75.6 /100 | #153 | Good 27.6% |
| Icelanders | 75.3 /100 | #154 | Good 27.6% |
| Comanche | 74.8 /100 | #155 | Good 27.6% |
| Hungarians | 74.6 /100 | #156 | Good 27.6% |
| Indians (Asian) | 71.6 /100 | #157 | Good 27.6% |
| Romanians | 70.8 /100 | #158 | Good 27.6% |
| Mongolians | 70.7 /100 | #159 | Good 27.6% |
| Sub-Saharan Africans | 67.5 /100 | #160 | Good 27.6% |
| Alaskan Athabascans | 67.1 /100 | #161 | Good 27.6% |
| Immigrants | Bangladesh | 67.0 /100 | #162 | Good 27.6% |
Demographics Similar to Immigrants from Belize by Family Households with Children
In terms of family households with children, the demographic groups most similar to Immigrants from Belize are Iranian (27.7%, a difference of 0.020%), Immigrants from Panama (27.7%, a difference of 0.040%), Immigrants from Ecuador (27.7%, a difference of 0.050%), Immigrants from Portugal (27.7%, a difference of 0.070%), and Lebanese (27.7%, a difference of 0.080%).
| Demographics | Rating | Rank | Family Households with Children |
| Ecuadorians | 90.8 /100 | #125 | Exceptional 27.8% |
| Immigrants | Ethiopia | 90.5 /100 | #126 | Exceptional 27.8% |
| Belizeans | 90.0 /100 | #127 | Exceptional 27.8% |
| Syrians | 89.7 /100 | #128 | Excellent 27.8% |
| Immigrants | Eritrea | 89.4 /100 | #129 | Excellent 27.8% |
| Cajuns | 87.6 /100 | #130 | Excellent 27.7% |
| Lebanese | 87.4 /100 | #131 | Excellent 27.7% |
| Immigrants | Belize | 85.7 /100 | #132 | Excellent 27.7% |
| Iranians | 85.2 /100 | #133 | Excellent 27.7% |
| Immigrants | Panama | 84.9 /100 | #134 | Excellent 27.7% |
| Immigrants | Ecuador | 84.6 /100 | #135 | Excellent 27.7% |
| Immigrants | Portugal | 84.1 /100 | #136 | Excellent 27.7% |
| Immigrants | Dominican Republic | 83.9 /100 | #137 | Excellent 27.7% |
| Uruguayans | 83.2 /100 | #138 | Excellent 27.7% |
| Vietnamese | 82.6 /100 | #139 | Excellent 27.7% |