Immigrants from Asia vs Immigrants from Syria Married-couple Households
COMPARE
Immigrants from Asia
Immigrants from Syria
Married-couple Households
Married-couple Households Comparison
Immigrants from Asia
Immigrants from Syria
49.1%
MARRIED-COUPLE HOUSEHOLDS
99.7/ 100
METRIC RATING
33rd/ 347
METRIC RANK
47.1%
MARRIED-COUPLE HOUSEHOLDS
81.6/ 100
METRIC RATING
147th/ 347
METRIC RANK
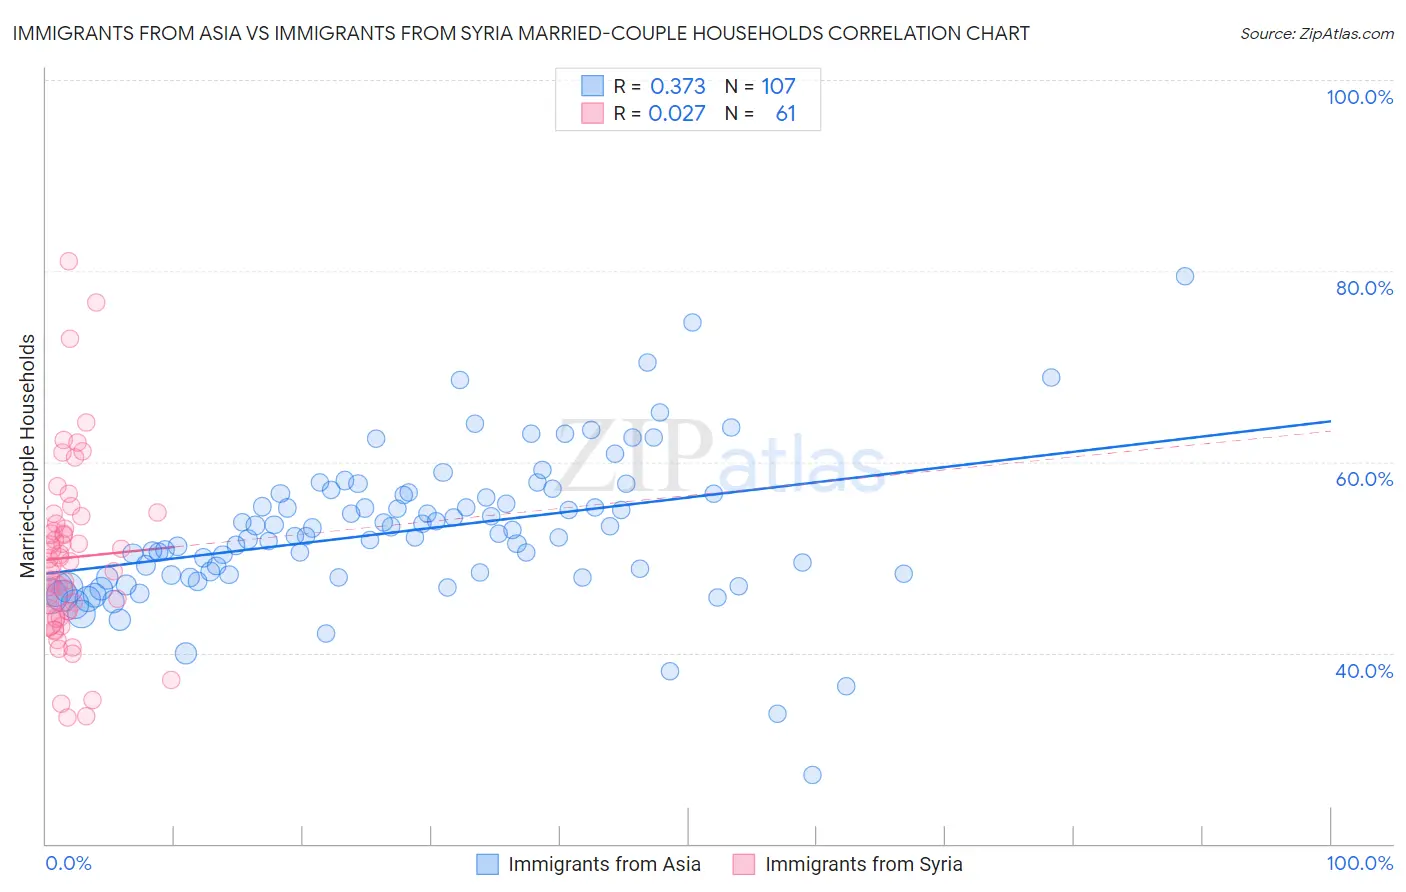
Immigrants from Asia vs Immigrants from Syria Married-couple Households Correlation Chart
The statistical analysis conducted on geographies consisting of 548,508,948 people shows a mild positive correlation between the proportion of Immigrants from Asia and percentage of married-couple family households in the United States with a correlation coefficient (R) of 0.373 and weighted average of 49.1%. Similarly, the statistical analysis conducted on geographies consisting of 174,106,206 people shows no correlation between the proportion of Immigrants from Syria and percentage of married-couple family households in the United States with a correlation coefficient (R) of 0.027 and weighted average of 47.1%, a difference of 4.2%.
Married-couple Households Correlation Summary
| Measurement | Immigrants from Asia | Immigrants from Syria |
| Minimum | 27.1% | 33.2% |
| Maximum | 79.5% | 81.0% |
| Range | 52.3% | 47.8% |
| Mean | 52.8% | 50.0% |
| Median | 52.2% | 49.5% |
| Interquartile 25% (IQ1) | 47.9% | 43.7% |
| Interquartile 75% (IQ3) | 56.6% | 53.9% |
| Interquartile Range (IQR) | 8.7% | 10.2% |
| Standard Deviation (Sample) | 7.7% | 9.4% |
| Standard Deviation (Population) | 7.7% | 9.4% |
Similar Demographics by Married-couple Households
Demographics Similar to Immigrants from Asia by Married-couple Households
In terms of married-couple households, the demographic groups most similar to Immigrants from Asia are Hungarian (49.1%, a difference of 0.030%), Italian (49.0%, a difference of 0.080%), Native Hawaiian (49.1%, a difference of 0.090%), Scottish (49.0%, a difference of 0.10%), and Iranian (49.0%, a difference of 0.19%).
| Demographics | Rating | Rank | Married-couple Households |
| Immigrants | Scotland | 99.8 /100 | #26 | Exceptional 49.3% |
| Bhutanese | 99.8 /100 | #27 | Exceptional 49.3% |
| Germans | 99.8 /100 | #28 | Exceptional 49.2% |
| Maltese | 99.8 /100 | #29 | Exceptional 49.2% |
| Bolivians | 99.8 /100 | #30 | Exceptional 49.2% |
| Native Hawaiians | 99.8 /100 | #31 | Exceptional 49.1% |
| Hungarians | 99.8 /100 | #32 | Exceptional 49.1% |
| Immigrants | Asia | 99.7 /100 | #33 | Exceptional 49.1% |
| Italians | 99.7 /100 | #34 | Exceptional 49.0% |
| Scottish | 99.7 /100 | #35 | Exceptional 49.0% |
| Iranians | 99.7 /100 | #36 | Exceptional 49.0% |
| Sri Lankans | 99.7 /100 | #37 | Exceptional 49.0% |
| Greeks | 99.7 /100 | #38 | Exceptional 48.9% |
| Lithuanians | 99.6 /100 | #39 | Exceptional 48.9% |
| Immigrants | Bolivia | 99.6 /100 | #40 | Exceptional 48.9% |
Demographics Similar to Immigrants from Syria by Married-couple Households
In terms of married-couple households, the demographic groups most similar to Immigrants from Syria are Immigrants from Western Europe (47.1%, a difference of 0.0%), Slovene (47.1%, a difference of 0.010%), Mexican (47.1%, a difference of 0.12%), Icelander (47.0%, a difference of 0.12%), and Immigrants from Belarus (47.2%, a difference of 0.14%).
| Demographics | Rating | Rank | Married-couple Households |
| Spanish | 84.5 /100 | #140 | Excellent 47.2% |
| Costa Ricans | 84.4 /100 | #141 | Excellent 47.2% |
| Spaniards | 84.1 /100 | #142 | Excellent 47.2% |
| Immigrants | Belarus | 83.8 /100 | #143 | Excellent 47.2% |
| Mexicans | 83.4 /100 | #144 | Excellent 47.1% |
| Slovenes | 81.7 /100 | #145 | Excellent 47.1% |
| Immigrants | Western Europe | 81.6 /100 | #146 | Excellent 47.1% |
| Immigrants | Syria | 81.6 /100 | #147 | Excellent 47.1% |
| Icelanders | 79.5 /100 | #148 | Good 47.0% |
| Paraguayans | 78.7 /100 | #149 | Good 47.0% |
| Immigrants | Russia | 77.6 /100 | #150 | Good 47.0% |
| Immigrants | Bulgaria | 76.8 /100 | #151 | Good 47.0% |
| Serbians | 76.3 /100 | #152 | Good 47.0% |
| Hmong | 76.2 /100 | #153 | Good 47.0% |
| Immigrants | Western Asia | 76.1 /100 | #154 | Good 46.9% |