Immigrants from Asia vs Immigrants from Syria Vision Disability
COMPARE
Immigrants from Asia
Immigrants from Syria
Vision Disability
Vision Disability Comparison
Immigrants from Asia
Immigrants from Syria
1.9%
VISION DISABILITY
99.9/ 100
METRIC RATING
23rd/ 347
METRIC RANK
2.1%
VISION DISABILITY
96.2/ 100
METRIC RATING
92nd/ 347
METRIC RANK
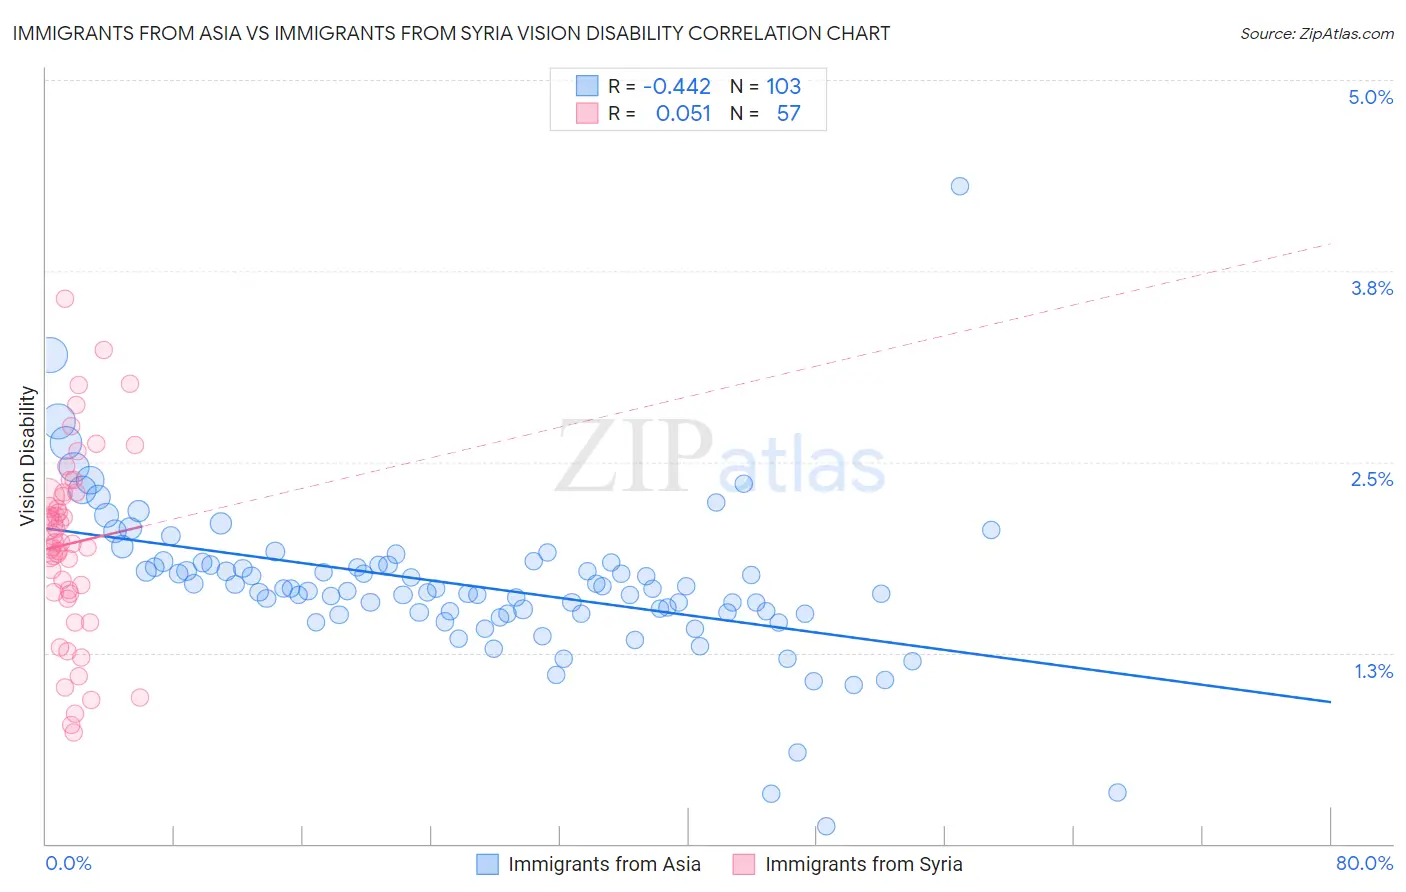
Immigrants from Asia vs Immigrants from Syria Vision Disability Correlation Chart
The statistical analysis conducted on geographies consisting of 547,864,164 people shows a moderate negative correlation between the proportion of Immigrants from Asia and percentage of population with vision disability in the United States with a correlation coefficient (R) of -0.442 and weighted average of 1.9%. Similarly, the statistical analysis conducted on geographies consisting of 174,077,138 people shows a slight positive correlation between the proportion of Immigrants from Syria and percentage of population with vision disability in the United States with a correlation coefficient (R) of 0.051 and weighted average of 2.1%, a difference of 7.2%.
Vision Disability Correlation Summary
| Measurement | Immigrants from Asia | Immigrants from Syria |
| Minimum | 0.11% | 0.73% |
| Maximum | 4.3% | 3.6% |
| Range | 4.2% | 2.8% |
| Mean | 1.7% | 2.0% |
| Median | 1.7% | 2.0% |
| Interquartile 25% (IQ1) | 1.5% | 1.6% |
| Interquartile 75% (IQ3) | 1.8% | 2.3% |
| Interquartile Range (IQR) | 0.32% | 0.65% |
| Standard Deviation (Sample) | 0.51% | 0.61% |
| Standard Deviation (Population) | 0.51% | 0.61% |
Similar Demographics by Vision Disability
Demographics Similar to Immigrants from Asia by Vision Disability
In terms of vision disability, the demographic groups most similar to Immigrants from Asia are Immigrants from Lithuania (1.9%, a difference of 0.12%), Bulgarian (1.9%, a difference of 0.16%), Immigrants from Japan (1.9%, a difference of 0.20%), Immigrants from Pakistan (1.9%, a difference of 0.54%), and Taiwanese (1.9%, a difference of 0.54%).
| Demographics | Rating | Rank | Vision Disability |
| Indians (Asian) | 100.0 /100 | #16 | Exceptional 1.8% |
| Burmese | 100.0 /100 | #17 | Exceptional 1.8% |
| Bolivians | 100.0 /100 | #18 | Exceptional 1.9% |
| Immigrants | Sri Lanka | 100.0 /100 | #19 | Exceptional 1.9% |
| Asians | 100.0 /100 | #20 | Exceptional 1.9% |
| Turks | 100.0 /100 | #21 | Exceptional 1.9% |
| Immigrants | Pakistan | 100.0 /100 | #22 | Exceptional 1.9% |
| Immigrants | Asia | 99.9 /100 | #23 | Exceptional 1.9% |
| Immigrants | Lithuania | 99.9 /100 | #24 | Exceptional 1.9% |
| Bulgarians | 99.9 /100 | #25 | Exceptional 1.9% |
| Immigrants | Japan | 99.9 /100 | #26 | Exceptional 1.9% |
| Taiwanese | 99.9 /100 | #27 | Exceptional 1.9% |
| Immigrants | Malaysia | 99.9 /100 | #28 | Exceptional 1.9% |
| Egyptians | 99.9 /100 | #29 | Exceptional 1.9% |
| Immigrants | Nepal | 99.9 /100 | #30 | Exceptional 1.9% |
Demographics Similar to Immigrants from Syria by Vision Disability
In terms of vision disability, the demographic groups most similar to Immigrants from Syria are Immigrants from Somalia (2.1%, a difference of 0.020%), Immigrants from Europe (2.1%, a difference of 0.050%), Immigrants from Croatia (2.1%, a difference of 0.070%), Australian (2.1%, a difference of 0.14%), and Romanian (2.1%, a difference of 0.20%).
| Demographics | Rating | Rank | Vision Disability |
| Chinese | 97.2 /100 | #85 | Exceptional 2.0% |
| Immigrants | Moldova | 97.2 /100 | #86 | Exceptional 2.0% |
| Immigrants | Switzerland | 97.0 /100 | #87 | Exceptional 2.0% |
| Norwegians | 97.0 /100 | #88 | Exceptional 2.0% |
| Immigrants | Eastern Africa | 97.0 /100 | #89 | Exceptional 2.0% |
| Immigrants | Lebanon | 96.7 /100 | #90 | Exceptional 2.1% |
| Immigrants | Somalia | 96.2 /100 | #91 | Exceptional 2.1% |
| Immigrants | Syria | 96.2 /100 | #92 | Exceptional 2.1% |
| Immigrants | Europe | 96.1 /100 | #93 | Exceptional 2.1% |
| Immigrants | Croatia | 96.0 /100 | #94 | Exceptional 2.1% |
| Australians | 95.9 /100 | #95 | Exceptional 2.1% |
| Romanians | 95.7 /100 | #96 | Exceptional 2.1% |
| Immigrants | Afghanistan | 95.6 /100 | #97 | Exceptional 2.1% |
| Immigrants | South Africa | 95.4 /100 | #98 | Exceptional 2.1% |
| Estonians | 95.3 /100 | #99 | Exceptional 2.1% |