Immigrants from Ireland vs Puget Sound Salish Family Households with Children
COMPARE
Immigrants from Ireland
Puget Sound Salish
Family Households with Children
Family Households with Children Comparison
Immigrants from Ireland
Puget Sound Salish
26.0%
FAMILY HOUSEHOLDS WITH CHILDREN
0.0/ 100
METRIC RATING
326th/ 347
METRIC RANK
27.4%
FAMILY HOUSEHOLDS WITH CHILDREN
46.2/ 100
METRIC RATING
182nd/ 347
METRIC RANK
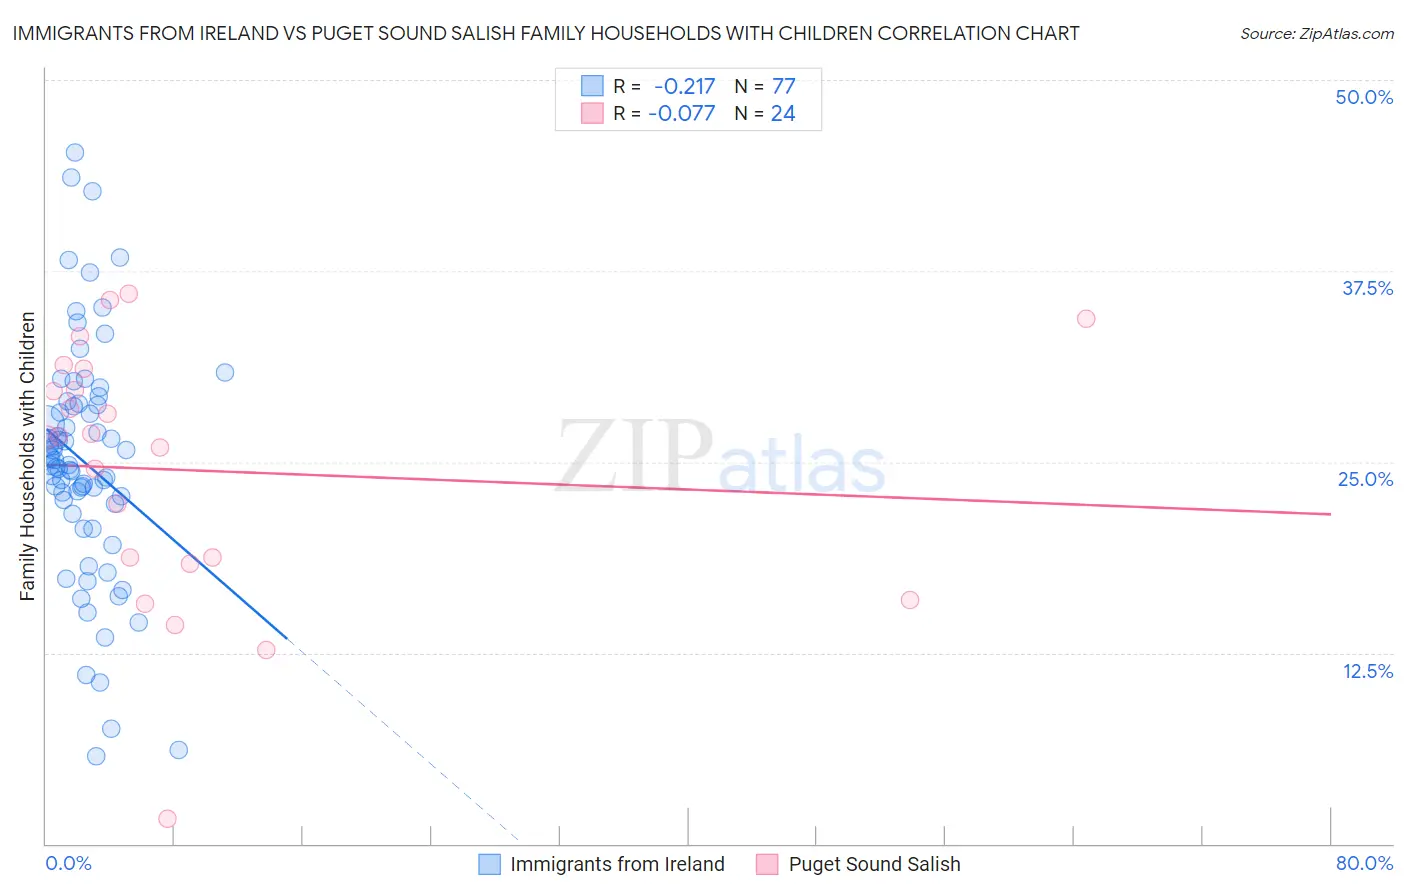
Immigrants from Ireland vs Puget Sound Salish Family Households with Children Correlation Chart
The statistical analysis conducted on geographies consisting of 240,683,763 people shows a weak negative correlation between the proportion of Immigrants from Ireland and percentage of family households with children in the United States with a correlation coefficient (R) of -0.217 and weighted average of 26.0%. Similarly, the statistical analysis conducted on geographies consisting of 46,155,538 people shows a slight negative correlation between the proportion of Puget Sound Salish and percentage of family households with children in the United States with a correlation coefficient (R) of -0.077 and weighted average of 27.4%, a difference of 5.5%.
Family Households with Children Correlation Summary
| Measurement | Immigrants from Ireland | Puget Sound Salish |
| Minimum | 5.7% | 1.6% |
| Maximum | 45.3% | 36.0% |
| Range | 39.6% | 34.3% |
| Mean | 25.0% | 24.4% |
| Median | 24.8% | 26.7% |
| Interquartile 25% (IQ1) | 21.9% | 18.5% |
| Interquartile 75% (IQ3) | 28.8% | 30.4% |
| Interquartile Range (IQR) | 6.9% | 11.9% |
| Standard Deviation (Sample) | 7.8% | 8.5% |
| Standard Deviation (Population) | 7.7% | 8.3% |
Similar Demographics by Family Households with Children
Demographics Similar to Immigrants from Ireland by Family Households with Children
In terms of family households with children, the demographic groups most similar to Immigrants from Ireland are Barbadian (26.0%, a difference of 0.030%), Chinese (26.0%, a difference of 0.080%), Immigrants from Barbados (26.0%, a difference of 0.11%), Immigrants from Australia (26.0%, a difference of 0.12%), and Immigrants from Greece (26.0%, a difference of 0.15%).
| Demographics | Rating | Rank | Family Households with Children |
| Immigrants | France | 0.0 /100 | #319 | Tragic 26.0% |
| Tlingit-Haida | 0.0 /100 | #320 | Tragic 26.0% |
| British West Indians | 0.0 /100 | #321 | Tragic 26.0% |
| Immigrants | Greece | 0.0 /100 | #322 | Tragic 26.0% |
| Immigrants | Australia | 0.0 /100 | #323 | Tragic 26.0% |
| Chinese | 0.0 /100 | #324 | Tragic 26.0% |
| Barbadians | 0.0 /100 | #325 | Tragic 26.0% |
| Immigrants | Ireland | 0.0 /100 | #326 | Tragic 26.0% |
| Immigrants | Barbados | 0.0 /100 | #327 | Tragic 26.0% |
| Immigrants | Albania | 0.0 /100 | #328 | Tragic 25.9% |
| Cypriots | 0.0 /100 | #329 | Tragic 25.9% |
| Immigrants | Latvia | 0.0 /100 | #330 | Tragic 25.9% |
| Slovenes | 0.0 /100 | #331 | Tragic 25.8% |
| Immigrants | Austria | 0.0 /100 | #332 | Tragic 25.8% |
| Immigrants | Switzerland | 0.0 /100 | #333 | Tragic 25.7% |
Demographics Similar to Puget Sound Salish by Family Households with Children
In terms of family households with children, the demographic groups most similar to Puget Sound Salish are Immigrants from Turkey (27.4%, a difference of 0.010%), Aleut (27.4%, a difference of 0.010%), Turkish (27.4%, a difference of 0.020%), South African (27.4%, a difference of 0.030%), and Native Hawaiian (27.4%, a difference of 0.040%).
| Demographics | Rating | Rank | Family Households with Children |
| British | 49.9 /100 | #175 | Average 27.4% |
| Immigrants | China | 49.6 /100 | #176 | Average 27.4% |
| Ugandans | 49.2 /100 | #177 | Average 27.4% |
| Spanish Americans | 48.9 /100 | #178 | Average 27.4% |
| Turks | 46.9 /100 | #179 | Average 27.4% |
| Immigrants | Turkey | 46.9 /100 | #180 | Average 27.4% |
| Aleuts | 46.7 /100 | #181 | Average 27.4% |
| Puget Sound Salish | 46.2 /100 | #182 | Average 27.4% |
| South Africans | 44.9 /100 | #183 | Average 27.4% |
| Native Hawaiians | 44.6 /100 | #184 | Average 27.4% |
| Delaware | 42.0 /100 | #185 | Average 27.4% |
| Immigrants | Brazil | 40.6 /100 | #186 | Average 27.4% |
| Creek | 39.8 /100 | #187 | Fair 27.4% |
| Dutch | 38.8 /100 | #188 | Fair 27.4% |
| Immigrants | Israel | 37.9 /100 | #189 | Fair 27.4% |