Guamanian/Chamorro vs Nepalese Births to Unmarried Women
COMPARE
Guamanian/Chamorro
Nepalese
Births to Unmarried Women
Births to Unmarried Women Comparison
Guamanians/Chamorros
Nepalese
31.6%
BIRTHS TO UNMARRIED WOMEN
51.3/ 100
METRIC RATING
170th/ 347
METRIC RANK
33.5%
BIRTHS TO UNMARRIED WOMEN
7.8/ 100
METRIC RATING
216th/ 347
METRIC RANK
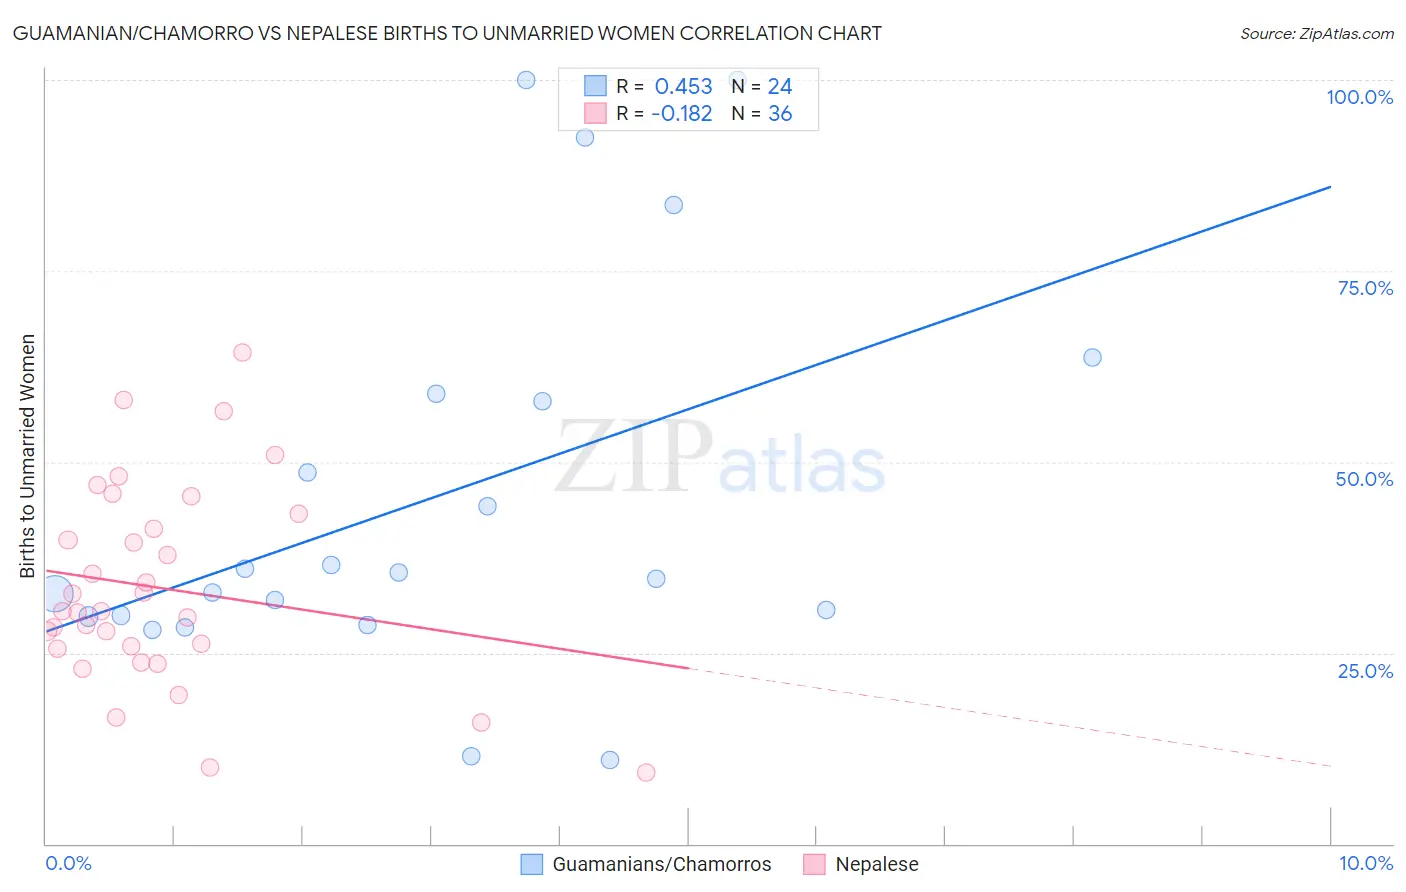
Guamanian/Chamorro vs Nepalese Births to Unmarried Women Correlation Chart
The statistical analysis conducted on geographies consisting of 213,790,025 people shows a moderate positive correlation between the proportion of Guamanians/Chamorros and percentage of births to unmarried women in the United States with a correlation coefficient (R) of 0.453 and weighted average of 31.6%. Similarly, the statistical analysis conducted on geographies consisting of 24,298,427 people shows a poor negative correlation between the proportion of Nepalese and percentage of births to unmarried women in the United States with a correlation coefficient (R) of -0.182 and weighted average of 33.5%, a difference of 6.0%.
Births to Unmarried Women Correlation Summary
| Measurement | Guamanian/Chamorro | Nepalese |
| Minimum | 10.9% | 9.3% |
| Maximum | 100.0% | 64.3% |
| Range | 89.1% | 55.0% |
| Mean | 45.3% | 33.5% |
| Median | 35.1% | 30.4% |
| Interquartile 25% (IQ1) | 29.8% | 25.7% |
| Interquartile 75% (IQ3) | 58.4% | 42.2% |
| Interquartile Range (IQR) | 28.6% | 16.5% |
| Standard Deviation (Sample) | 25.6% | 13.0% |
| Standard Deviation (Population) | 25.1% | 12.8% |
Similar Demographics by Births to Unmarried Women
Demographics Similar to Guamanians/Chamorros by Births to Unmarried Women
In terms of births to unmarried women, the demographic groups most similar to Guamanians/Chamorros are Slavic (31.6%, a difference of 0.070%), Finnish (31.7%, a difference of 0.080%), Immigrants from Eritrea (31.7%, a difference of 0.090%), Belgian (31.6%, a difference of 0.10%), and Immigrants from Yemen (31.7%, a difference of 0.10%).
| Demographics | Rating | Rank | Births to Unmarried Women |
| Immigrants | Chile | 65.7 /100 | #163 | Good 31.2% |
| Hungarians | 64.1 /100 | #164 | Good 31.2% |
| Immigrants | Somalia | 58.1 /100 | #165 | Average 31.4% |
| Peruvians | 55.5 /100 | #166 | Average 31.5% |
| Dutch | 55.3 /100 | #167 | Average 31.5% |
| Belgians | 52.4 /100 | #168 | Average 31.6% |
| Slavs | 52.0 /100 | #169 | Average 31.6% |
| Guamanians/Chamorros | 51.3 /100 | #170 | Average 31.6% |
| Finns | 50.5 /100 | #171 | Average 31.7% |
| Immigrants | Eritrea | 50.4 /100 | #172 | Average 31.7% |
| Immigrants | Yemen | 50.2 /100 | #173 | Average 31.7% |
| Venezuelans | 50.0 /100 | #174 | Average 31.7% |
| Immigrants | Venezuela | 49.2 /100 | #175 | Average 31.7% |
| Scottish | 48.1 /100 | #176 | Average 31.7% |
| South American Indians | 47.7 /100 | #177 | Average 31.7% |
Demographics Similar to Nepalese by Births to Unmarried Women
In terms of births to unmarried women, the demographic groups most similar to Nepalese are Spaniard (33.6%, a difference of 0.24%), French (33.4%, a difference of 0.27%), Slovak (33.4%, a difference of 0.45%), Immigrants from Costa Rica (33.4%, a difference of 0.49%), and Immigrants from Ecuador (33.7%, a difference of 0.64%).
| Demographics | Rating | Rank | Births to Unmarried Women |
| Whites/Caucasians | 10.7 /100 | #209 | Poor 33.3% |
| Scotch-Irish | 10.7 /100 | #210 | Poor 33.3% |
| Ecuadorians | 10.5 /100 | #211 | Poor 33.3% |
| Celtics | 10.2 /100 | #212 | Poor 33.3% |
| Immigrants | Costa Rica | 9.5 /100 | #213 | Tragic 33.4% |
| Slovaks | 9.3 /100 | #214 | Tragic 33.4% |
| French | 8.7 /100 | #215 | Tragic 33.4% |
| Nepalese | 7.8 /100 | #216 | Tragic 33.5% |
| Spaniards | 7.0 /100 | #217 | Tragic 33.6% |
| Immigrants | Ecuador | 5.9 /100 | #218 | Tragic 33.7% |
| Alsatians | 5.4 /100 | #219 | Tragic 33.8% |
| Portuguese | 5.4 /100 | #220 | Tragic 33.8% |
| Malaysians | 5.0 /100 | #221 | Tragic 33.9% |
| Immigrants | Uruguay | 4.8 /100 | #222 | Tragic 33.9% |
| Pennsylvania Germans | 4.3 /100 | #223 | Tragic 34.0% |