Guamanian/Chamorro vs Immigrants from Lebanon Births to Unmarried Women
COMPARE
Guamanian/Chamorro
Immigrants from Lebanon
Births to Unmarried Women
Births to Unmarried Women Comparison
Guamanians/Chamorros
Immigrants from Lebanon
31.6%
BIRTHS TO UNMARRIED WOMEN
51.3/ 100
METRIC RATING
170th/ 347
METRIC RANK
25.3%
BIRTHS TO UNMARRIED WOMEN
100.0/ 100
METRIC RATING
14th/ 347
METRIC RANK
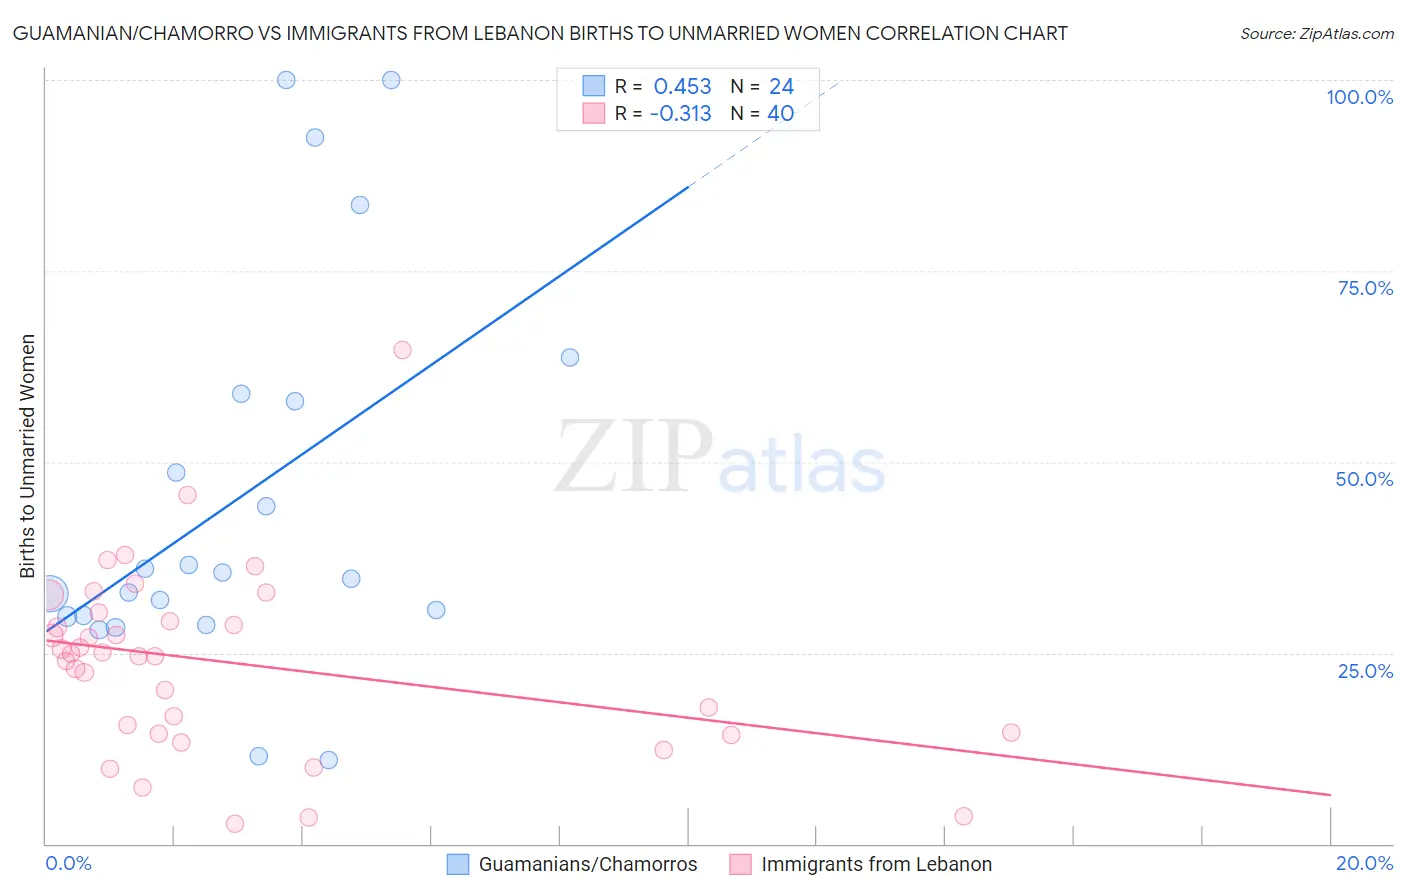
Guamanian/Chamorro vs Immigrants from Lebanon Births to Unmarried Women Correlation Chart
The statistical analysis conducted on geographies consisting of 213,790,025 people shows a moderate positive correlation between the proportion of Guamanians/Chamorros and percentage of births to unmarried women in the United States with a correlation coefficient (R) of 0.453 and weighted average of 31.6%. Similarly, the statistical analysis conducted on geographies consisting of 205,801,524 people shows a mild negative correlation between the proportion of Immigrants from Lebanon and percentage of births to unmarried women in the United States with a correlation coefficient (R) of -0.313 and weighted average of 25.3%, a difference of 24.9%.
Births to Unmarried Women Correlation Summary
| Measurement | Guamanian/Chamorro | Immigrants from Lebanon |
| Minimum | 10.9% | 2.7% |
| Maximum | 100.0% | 64.7% |
| Range | 89.1% | 62.0% |
| Mean | 45.3% | 23.7% |
| Median | 35.1% | 24.8% |
| Interquartile 25% (IQ1) | 29.8% | 14.5% |
| Interquartile 75% (IQ3) | 58.4% | 29.7% |
| Interquartile Range (IQR) | 28.6% | 15.2% |
| Standard Deviation (Sample) | 25.6% | 12.2% |
| Standard Deviation (Population) | 25.1% | 12.0% |
Similar Demographics by Births to Unmarried Women
Demographics Similar to Guamanians/Chamorros by Births to Unmarried Women
In terms of births to unmarried women, the demographic groups most similar to Guamanians/Chamorros are Slavic (31.6%, a difference of 0.070%), Finnish (31.7%, a difference of 0.080%), Immigrants from Eritrea (31.7%, a difference of 0.090%), Belgian (31.6%, a difference of 0.10%), and Immigrants from Yemen (31.7%, a difference of 0.10%).
| Demographics | Rating | Rank | Births to Unmarried Women |
| Immigrants | Chile | 65.7 /100 | #163 | Good 31.2% |
| Hungarians | 64.1 /100 | #164 | Good 31.2% |
| Immigrants | Somalia | 58.1 /100 | #165 | Average 31.4% |
| Peruvians | 55.5 /100 | #166 | Average 31.5% |
| Dutch | 55.3 /100 | #167 | Average 31.5% |
| Belgians | 52.4 /100 | #168 | Average 31.6% |
| Slavs | 52.0 /100 | #169 | Average 31.6% |
| Guamanians/Chamorros | 51.3 /100 | #170 | Average 31.6% |
| Finns | 50.5 /100 | #171 | Average 31.7% |
| Immigrants | Eritrea | 50.4 /100 | #172 | Average 31.7% |
| Immigrants | Yemen | 50.2 /100 | #173 | Average 31.7% |
| Venezuelans | 50.0 /100 | #174 | Average 31.7% |
| Immigrants | Venezuela | 49.2 /100 | #175 | Average 31.7% |
| Scottish | 48.1 /100 | #176 | Average 31.7% |
| South American Indians | 47.7 /100 | #177 | Average 31.7% |
Demographics Similar to Immigrants from Lebanon by Births to Unmarried Women
In terms of births to unmarried women, the demographic groups most similar to Immigrants from Lebanon are Iranian (25.3%, a difference of 0.12%), Indian (Asian) (25.3%, a difference of 0.26%), Immigrants from Israel (25.1%, a difference of 0.73%), Immigrants from Eastern Asia (25.0%, a difference of 1.2%), and Immigrants from Singapore (25.6%, a difference of 1.2%).
| Demographics | Rating | Rank | Births to Unmarried Women |
| Thais | 100.0 /100 | #7 | Exceptional 24.0% |
| Immigrants | China | 100.0 /100 | #8 | Exceptional 24.7% |
| Immigrants | South Central Asia | 100.0 /100 | #9 | Exceptional 24.7% |
| Immigrants | Eastern Asia | 100.0 /100 | #10 | Exceptional 25.0% |
| Immigrants | Israel | 100.0 /100 | #11 | Exceptional 25.1% |
| Indians (Asian) | 100.0 /100 | #12 | Exceptional 25.3% |
| Iranians | 100.0 /100 | #13 | Exceptional 25.3% |
| Immigrants | Lebanon | 100.0 /100 | #14 | Exceptional 25.3% |
| Immigrants | Singapore | 100.0 /100 | #15 | Exceptional 25.6% |
| Immigrants | Belarus | 100.0 /100 | #16 | Exceptional 25.6% |
| Immigrants | Uzbekistan | 100.0 /100 | #17 | Exceptional 25.8% |
| Immigrants | Armenia | 99.9 /100 | #18 | Exceptional 26.1% |
| Armenians | 99.9 /100 | #19 | Exceptional 26.2% |
| Immigrants | Korea | 99.9 /100 | #20 | Exceptional 26.3% |
| Soviet Union | 99.9 /100 | #21 | Exceptional 26.3% |