Guamanian/Chamorro vs Immigrants from Colombia Births to Unmarried Women
COMPARE
Guamanian/Chamorro
Immigrants from Colombia
Births to Unmarried Women
Births to Unmarried Women Comparison
Guamanians/Chamorros
Immigrants from Colombia
31.6%
BIRTHS TO UNMARRIED WOMEN
51.3/ 100
METRIC RATING
170th/ 347
METRIC RANK
32.6%
BIRTHS TO UNMARRIED WOMEN
21.7/ 100
METRIC RATING
196th/ 347
METRIC RANK
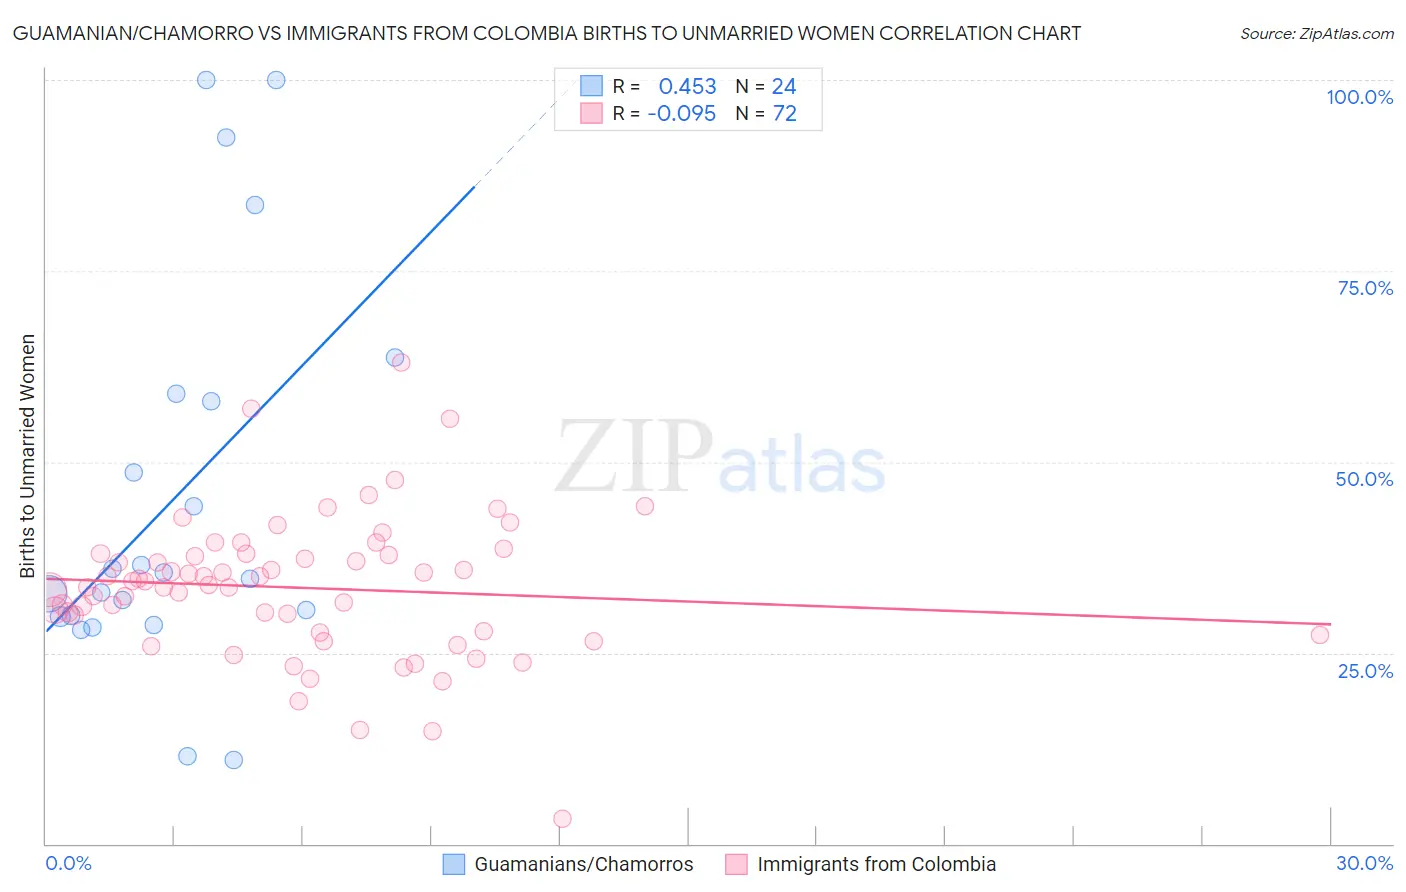
Guamanian/Chamorro vs Immigrants from Colombia Births to Unmarried Women Correlation Chart
The statistical analysis conducted on geographies consisting of 213,790,025 people shows a moderate positive correlation between the proportion of Guamanians/Chamorros and percentage of births to unmarried women in the United States with a correlation coefficient (R) of 0.453 and weighted average of 31.6%. Similarly, the statistical analysis conducted on geographies consisting of 355,596,332 people shows a slight negative correlation between the proportion of Immigrants from Colombia and percentage of births to unmarried women in the United States with a correlation coefficient (R) of -0.095 and weighted average of 32.6%, a difference of 3.2%.
Births to Unmarried Women Correlation Summary
| Measurement | Guamanian/Chamorro | Immigrants from Colombia |
| Minimum | 10.9% | 3.3% |
| Maximum | 100.0% | 63.1% |
| Range | 89.1% | 59.8% |
| Mean | 45.3% | 33.5% |
| Median | 35.1% | 34.1% |
| Interquartile 25% (IQ1) | 29.8% | 27.8% |
| Interquartile 75% (IQ3) | 58.4% | 37.9% |
| Interquartile Range (IQR) | 28.6% | 10.1% |
| Standard Deviation (Sample) | 25.6% | 9.4% |
| Standard Deviation (Population) | 25.1% | 9.3% |
Similar Demographics by Births to Unmarried Women
Demographics Similar to Guamanians/Chamorros by Births to Unmarried Women
In terms of births to unmarried women, the demographic groups most similar to Guamanians/Chamorros are Slavic (31.6%, a difference of 0.070%), Finnish (31.7%, a difference of 0.080%), Immigrants from Eritrea (31.7%, a difference of 0.090%), Belgian (31.6%, a difference of 0.10%), and Immigrants from Yemen (31.7%, a difference of 0.10%).
| Demographics | Rating | Rank | Births to Unmarried Women |
| Immigrants | Chile | 65.7 /100 | #163 | Good 31.2% |
| Hungarians | 64.1 /100 | #164 | Good 31.2% |
| Immigrants | Somalia | 58.1 /100 | #165 | Average 31.4% |
| Peruvians | 55.5 /100 | #166 | Average 31.5% |
| Dutch | 55.3 /100 | #167 | Average 31.5% |
| Belgians | 52.4 /100 | #168 | Average 31.6% |
| Slavs | 52.0 /100 | #169 | Average 31.6% |
| Guamanians/Chamorros | 51.3 /100 | #170 | Average 31.6% |
| Finns | 50.5 /100 | #171 | Average 31.7% |
| Immigrants | Eritrea | 50.4 /100 | #172 | Average 31.7% |
| Immigrants | Yemen | 50.2 /100 | #173 | Average 31.7% |
| Venezuelans | 50.0 /100 | #174 | Average 31.7% |
| Immigrants | Venezuela | 49.2 /100 | #175 | Average 31.7% |
| Scottish | 48.1 /100 | #176 | Average 31.7% |
| South American Indians | 47.7 /100 | #177 | Average 31.7% |
Demographics Similar to Immigrants from Colombia by Births to Unmarried Women
In terms of births to unmarried women, the demographic groups most similar to Immigrants from Colombia are Samoan (32.6%, a difference of 0.030%), Immigrants (32.7%, a difference of 0.15%), Costa Rican (32.7%, a difference of 0.20%), Immigrants from Thailand (32.8%, a difference of 0.40%), and Immigrants from Germany (32.8%, a difference of 0.42%).
| Demographics | Rating | Rank | Births to Unmarried Women |
| Immigrants | Kenya | 36.9 /100 | #189 | Fair 32.1% |
| Tlingit-Haida | 32.6 /100 | #190 | Fair 32.2% |
| Irish | 32.4 /100 | #191 | Fair 32.2% |
| Colombians | 31.9 /100 | #192 | Fair 32.2% |
| Fijians | 31.1 /100 | #193 | Fair 32.3% |
| Sudanese | 27.3 /100 | #194 | Fair 32.4% |
| Samoans | 21.9 /100 | #195 | Fair 32.6% |
| Immigrants | Colombia | 21.7 /100 | #196 | Fair 32.6% |
| Immigrants | Immigrants | 20.6 /100 | #197 | Fair 32.7% |
| Costa Ricans | 20.3 /100 | #198 | Fair 32.7% |
| Immigrants | Thailand | 18.9 /100 | #199 | Poor 32.8% |
| Immigrants | Germany | 18.8 /100 | #200 | Poor 32.8% |
| Immigrants | Burma/Myanmar | 16.7 /100 | #201 | Poor 32.9% |
| Immigrants | Micronesia | 16.6 /100 | #202 | Poor 32.9% |
| Ute | 14.4 /100 | #203 | Poor 33.0% |