Guamanian/Chamorro vs Shoshone Births to Unmarried Women
COMPARE
Guamanian/Chamorro
Shoshone
Births to Unmarried Women
Births to Unmarried Women Comparison
Guamanians/Chamorros
Shoshone
31.6%
BIRTHS TO UNMARRIED WOMEN
51.3/ 100
METRIC RATING
170th/ 347
METRIC RANK
35.3%
BIRTHS TO UNMARRIED WOMEN
0.8/ 100
METRIC RATING
245th/ 347
METRIC RANK
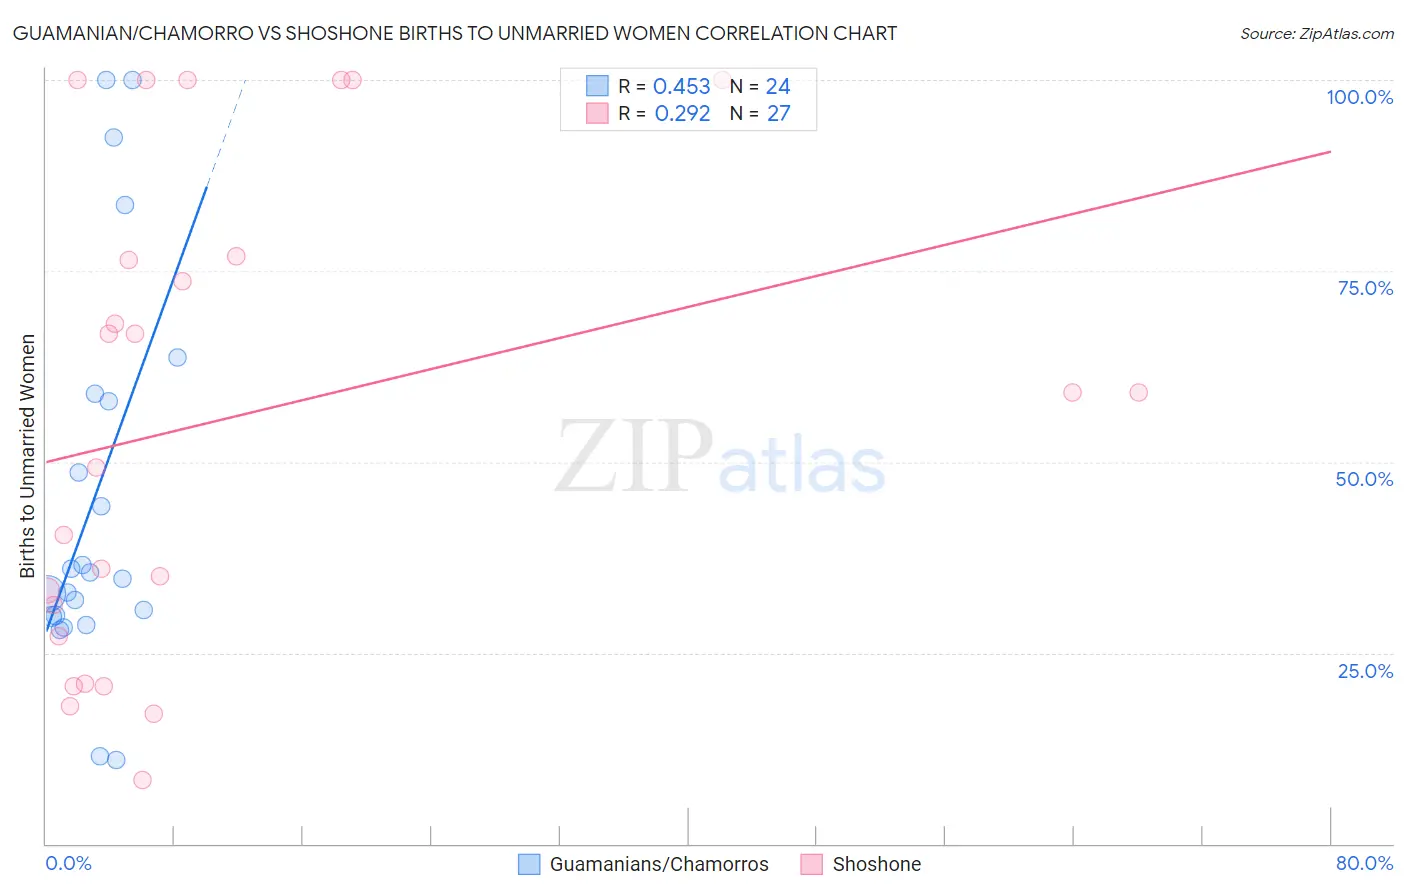
Guamanian/Chamorro vs Shoshone Births to Unmarried Women Correlation Chart
The statistical analysis conducted on geographies consisting of 213,790,025 people shows a moderate positive correlation between the proportion of Guamanians/Chamorros and percentage of births to unmarried women in the United States with a correlation coefficient (R) of 0.453 and weighted average of 31.6%. Similarly, the statistical analysis conducted on geographies consisting of 65,659,709 people shows a weak positive correlation between the proportion of Shoshone and percentage of births to unmarried women in the United States with a correlation coefficient (R) of 0.292 and weighted average of 35.3%, a difference of 11.6%.
Births to Unmarried Women Correlation Summary
| Measurement | Guamanian/Chamorro | Shoshone |
| Minimum | 10.9% | 8.3% |
| Maximum | 100.0% | 100.0% |
| Range | 89.1% | 91.7% |
| Mean | 45.3% | 55.7% |
| Median | 35.1% | 59.1% |
| Interquartile 25% (IQ1) | 29.8% | 27.2% |
| Interquartile 75% (IQ3) | 58.4% | 76.9% |
| Interquartile Range (IQR) | 28.6% | 49.7% |
| Standard Deviation (Sample) | 25.6% | 31.1% |
| Standard Deviation (Population) | 25.1% | 30.6% |
Similar Demographics by Births to Unmarried Women
Demographics Similar to Guamanians/Chamorros by Births to Unmarried Women
In terms of births to unmarried women, the demographic groups most similar to Guamanians/Chamorros are Slavic (31.6%, a difference of 0.070%), Finnish (31.7%, a difference of 0.080%), Immigrants from Eritrea (31.7%, a difference of 0.090%), Belgian (31.6%, a difference of 0.10%), and Immigrants from Yemen (31.7%, a difference of 0.10%).
| Demographics | Rating | Rank | Births to Unmarried Women |
| Immigrants | Chile | 65.7 /100 | #163 | Good 31.2% |
| Hungarians | 64.1 /100 | #164 | Good 31.2% |
| Immigrants | Somalia | 58.1 /100 | #165 | Average 31.4% |
| Peruvians | 55.5 /100 | #166 | Average 31.5% |
| Dutch | 55.3 /100 | #167 | Average 31.5% |
| Belgians | 52.4 /100 | #168 | Average 31.6% |
| Slavs | 52.0 /100 | #169 | Average 31.6% |
| Guamanians/Chamorros | 51.3 /100 | #170 | Average 31.6% |
| Finns | 50.5 /100 | #171 | Average 31.7% |
| Immigrants | Eritrea | 50.4 /100 | #172 | Average 31.7% |
| Immigrants | Yemen | 50.2 /100 | #173 | Average 31.7% |
| Venezuelans | 50.0 /100 | #174 | Average 31.7% |
| Immigrants | Venezuela | 49.2 /100 | #175 | Average 31.7% |
| Scottish | 48.1 /100 | #176 | Average 31.7% |
| South American Indians | 47.7 /100 | #177 | Average 31.7% |
Demographics Similar to Shoshone by Births to Unmarried Women
In terms of births to unmarried women, the demographic groups most similar to Shoshone are Nigerian (35.3%, a difference of 0.11%), Immigrants from Nigeria (35.4%, a difference of 0.32%), Guyanese (35.2%, a difference of 0.34%), Japanese (35.2%, a difference of 0.40%), and Nonimmigrants (35.5%, a difference of 0.65%).
| Demographics | Rating | Rank | Births to Unmarried Women |
| Immigrants | Cambodia | 1.6 /100 | #238 | Tragic 34.8% |
| Sierra Leoneans | 1.4 /100 | #239 | Tragic 34.9% |
| Immigrants | Middle Africa | 1.2 /100 | #240 | Tragic 34.9% |
| Immigrants | Guyana | 1.2 /100 | #241 | Tragic 35.0% |
| Indonesians | 1.2 /100 | #242 | Tragic 35.0% |
| Japanese | 0.9 /100 | #243 | Tragic 35.2% |
| Guyanese | 0.9 /100 | #244 | Tragic 35.2% |
| Shoshone | 0.8 /100 | #245 | Tragic 35.3% |
| Nigerians | 0.7 /100 | #246 | Tragic 35.3% |
| Immigrants | Nigeria | 0.7 /100 | #247 | Tragic 35.4% |
| Immigrants | Nonimmigrants | 0.6 /100 | #248 | Tragic 35.5% |
| Bermudans | 0.6 /100 | #249 | Tragic 35.5% |
| Mexican American Indians | 0.4 /100 | #250 | Tragic 35.7% |
| Immigrants | Western Africa | 0.3 /100 | #251 | Tragic 36.0% |
| Salvadorans | 0.3 /100 | #252 | Tragic 36.0% |