Black/African American vs Guyanese Family Households with Children
COMPARE
Black/African American
Guyanese
Family Households with Children
Family Households with Children Comparison
Blacks/African Americans
Guyanese
26.5%
FAMILY HOUSEHOLDS WITH CHILDREN
0.1/ 100
METRIC RATING
293rd/ 347
METRIC RANK
26.3%
FAMILY HOUSEHOLDS WITH CHILDREN
0.1/ 100
METRIC RATING
305th/ 347
METRIC RANK
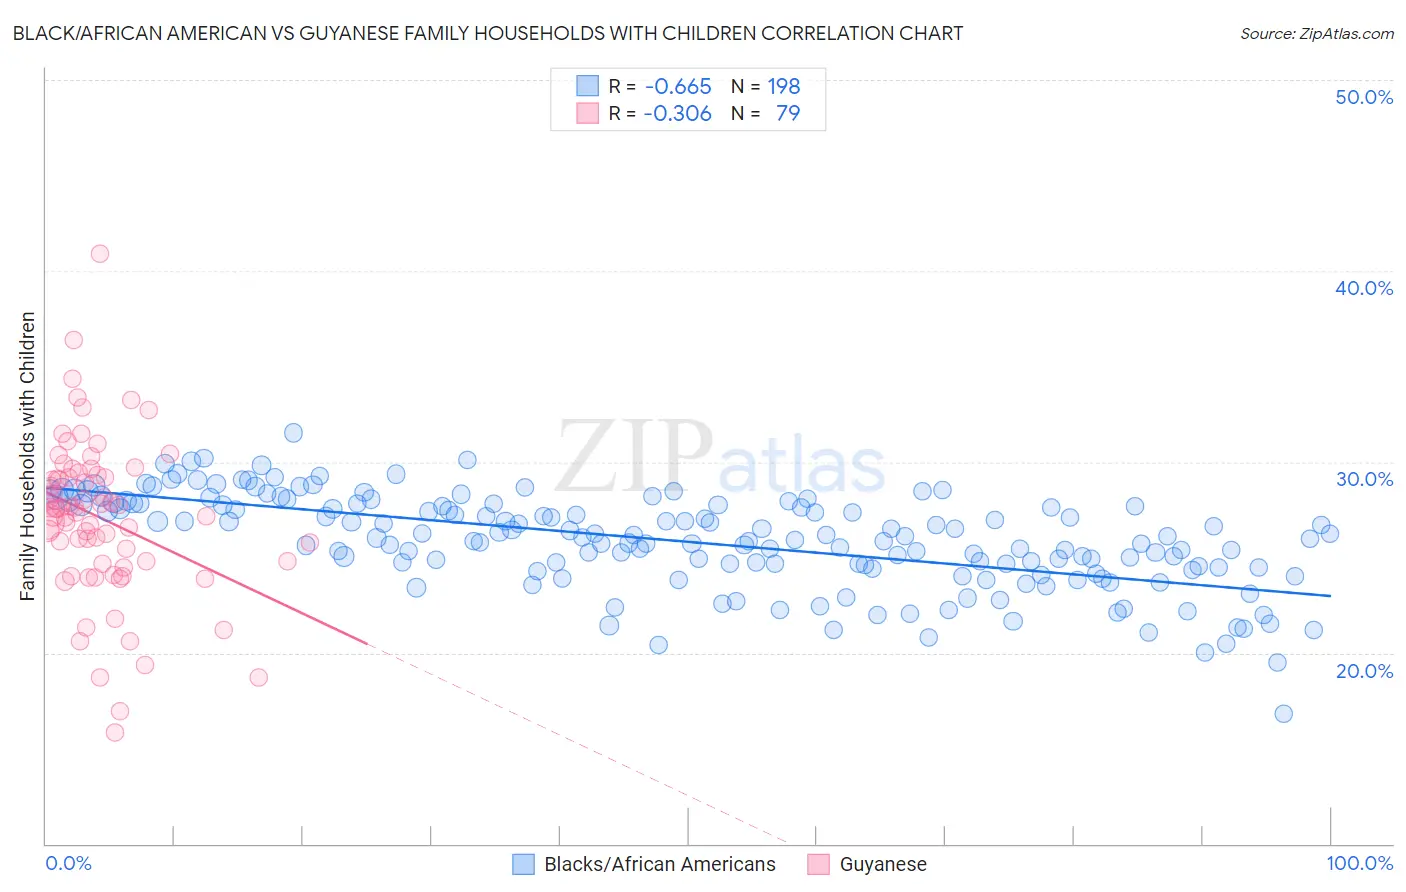
Black/African American vs Guyanese Family Households with Children Correlation Chart
The statistical analysis conducted on geographies consisting of 564,937,994 people shows a significant negative correlation between the proportion of Blacks/African Americans and percentage of family households with children in the United States with a correlation coefficient (R) of -0.665 and weighted average of 26.5%. Similarly, the statistical analysis conducted on geographies consisting of 176,724,893 people shows a mild negative correlation between the proportion of Guyanese and percentage of family households with children in the United States with a correlation coefficient (R) of -0.306 and weighted average of 26.3%, a difference of 0.53%.
Family Households with Children Correlation Summary
| Measurement | Black/African American | Guyanese |
| Minimum | 16.8% | 15.8% |
| Maximum | 31.5% | 40.9% |
| Range | 14.7% | 25.1% |
| Mean | 25.8% | 27.1% |
| Median | 26.0% | 27.5% |
| Interquartile 25% (IQ1) | 24.5% | 24.7% |
| Interquartile 75% (IQ3) | 27.7% | 29.3% |
| Interquartile Range (IQR) | 3.2% | 4.7% |
| Standard Deviation (Sample) | 2.5% | 4.2% |
| Standard Deviation (Population) | 2.4% | 4.2% |
Demographics Similar to Blacks/African Americans and Guyanese by Family Households with Children
In terms of family households with children, the demographic groups most similar to Blacks/African Americans are Polish (26.5%, a difference of 0.050%), Albanian (26.5%, a difference of 0.060%), Bahamian (26.5%, a difference of 0.060%), Latvian (26.4%, a difference of 0.060%), and Macedonian (26.4%, a difference of 0.13%). Similarly, the demographic groups most similar to Guyanese are Bermudan (26.3%, a difference of 0.010%), Immigrants from Bahamas (26.3%, a difference of 0.030%), Immigrants from Guyana (26.3%, a difference of 0.080%), West Indian (26.3%, a difference of 0.10%), and Serbian (26.4%, a difference of 0.11%).
| Demographics | Rating | Rank | Family Households with Children |
| Immigrants | Sweden | 0.2 /100 | #289 | Tragic 26.5% |
| Albanians | 0.2 /100 | #290 | Tragic 26.5% |
| Bahamians | 0.2 /100 | #291 | Tragic 26.5% |
| Poles | 0.2 /100 | #292 | Tragic 26.5% |
| Blacks/African Americans | 0.1 /100 | #293 | Tragic 26.5% |
| Latvians | 0.1 /100 | #294 | Tragic 26.4% |
| Macedonians | 0.1 /100 | #295 | Tragic 26.4% |
| Croatians | 0.1 /100 | #296 | Tragic 26.4% |
| Armenians | 0.1 /100 | #297 | Tragic 26.4% |
| Immigrants | Western Europe | 0.1 /100 | #298 | Tragic 26.4% |
| Trinidadians and Tobagonians | 0.1 /100 | #299 | Tragic 26.4% |
| Paiute | 0.1 /100 | #300 | Tragic 26.4% |
| Immigrants | Trinidad and Tobago | 0.1 /100 | #301 | Tragic 26.4% |
| Serbians | 0.1 /100 | #302 | Tragic 26.4% |
| Immigrants | Guyana | 0.1 /100 | #303 | Tragic 26.3% |
| Immigrants | Bahamas | 0.1 /100 | #304 | Tragic 26.3% |
| Guyanese | 0.1 /100 | #305 | Tragic 26.3% |
| Bermudans | 0.1 /100 | #306 | Tragic 26.3% |
| West Indians | 0.0 /100 | #307 | Tragic 26.3% |
| Lumbee | 0.0 /100 | #308 | Tragic 26.3% |
| Immigrants | Somalia | 0.0 /100 | #309 | Tragic 26.3% |