Black/African American vs Welsh Family Households with Children
COMPARE
Black/African American
Welsh
Family Households with Children
Family Households with Children Comparison
Blacks/African Americans
Welsh
26.5%
FAMILY HOUSEHOLDS WITH CHILDREN
0.1/ 100
METRIC RATING
293rd/ 347
METRIC RANK
27.2%
FAMILY HOUSEHOLDS WITH CHILDREN
14.2/ 100
METRIC RATING
211th/ 347
METRIC RANK
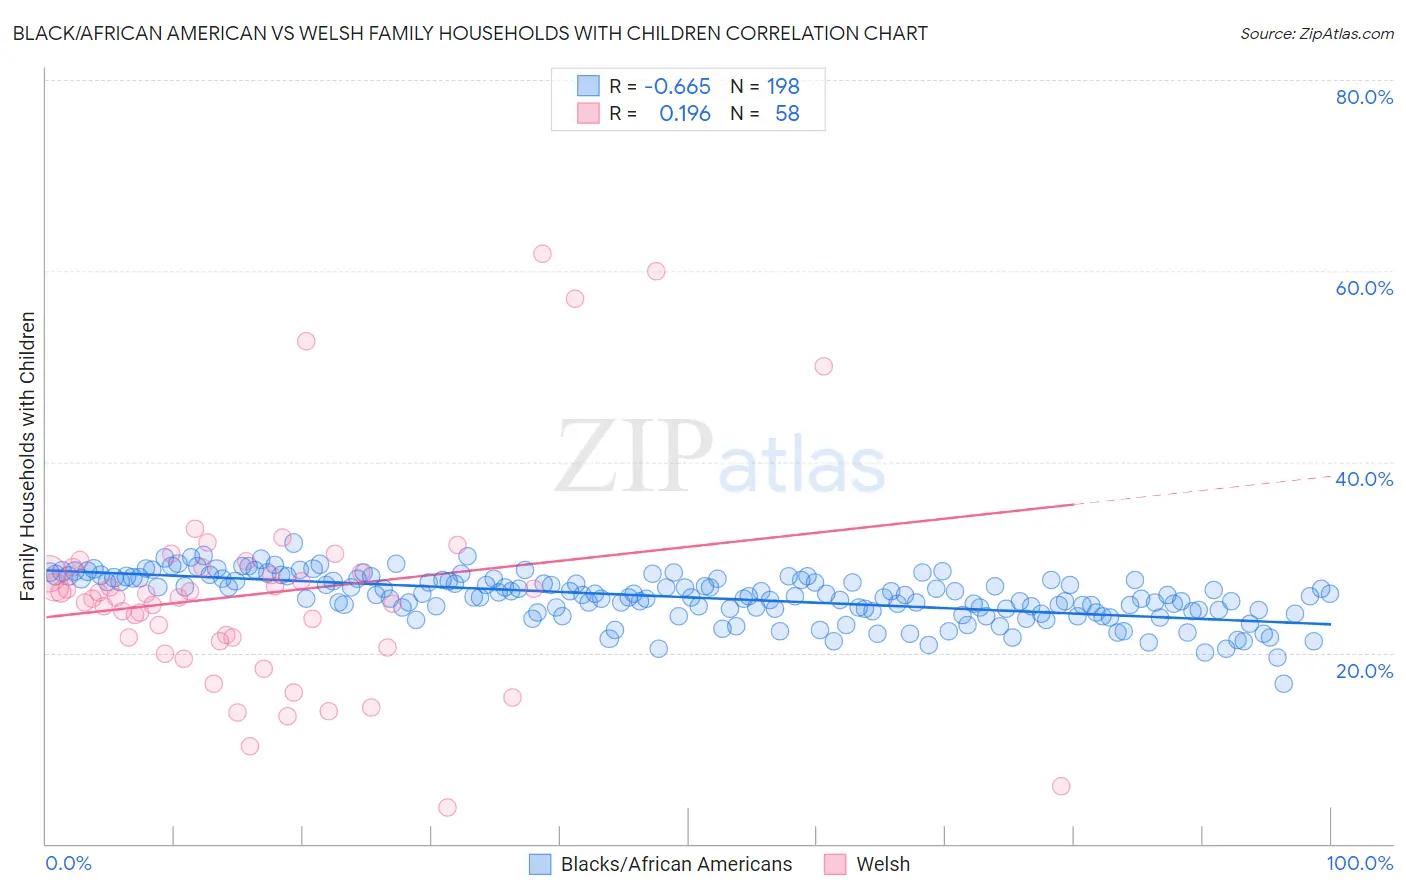
Black/African American vs Welsh Family Households with Children Correlation Chart
The statistical analysis conducted on geographies consisting of 564,937,994 people shows a significant negative correlation between the proportion of Blacks/African Americans and percentage of family households with children in the United States with a correlation coefficient (R) of -0.665 and weighted average of 26.5%. Similarly, the statistical analysis conducted on geographies consisting of 527,895,960 people shows a poor positive correlation between the proportion of Welsh and percentage of family households with children in the United States with a correlation coefficient (R) of 0.196 and weighted average of 27.2%, a difference of 2.7%.
Family Households with Children Correlation Summary
| Measurement | Black/African American | Welsh |
| Minimum | 16.8% | 3.8% |
| Maximum | 31.5% | 61.8% |
| Range | 14.7% | 58.0% |
| Mean | 25.8% | 26.3% |
| Median | 26.0% | 25.8% |
| Interquartile 25% (IQ1) | 24.5% | 21.2% |
| Interquartile 75% (IQ3) | 27.7% | 28.9% |
| Interquartile Range (IQR) | 3.2% | 7.7% |
| Standard Deviation (Sample) | 2.5% | 11.3% |
| Standard Deviation (Population) | 2.4% | 11.2% |
Similar Demographics by Family Households with Children
Demographics Similar to Blacks/African Americans by Family Households with Children
In terms of family households with children, the demographic groups most similar to Blacks/African Americans are Polish (26.5%, a difference of 0.050%), Albanian (26.5%, a difference of 0.060%), Bahamian (26.5%, a difference of 0.060%), Latvian (26.4%, a difference of 0.060%), and Macedonian (26.4%, a difference of 0.13%).
| Demographics | Rating | Rank | Family Households with Children |
| Immigrants | Senegal | 0.2 /100 | #286 | Tragic 26.5% |
| Shoshone | 0.2 /100 | #287 | Tragic 26.5% |
| Russians | 0.2 /100 | #288 | Tragic 26.5% |
| Immigrants | Sweden | 0.2 /100 | #289 | Tragic 26.5% |
| Albanians | 0.2 /100 | #290 | Tragic 26.5% |
| Bahamians | 0.2 /100 | #291 | Tragic 26.5% |
| Poles | 0.2 /100 | #292 | Tragic 26.5% |
| Blacks/African Americans | 0.1 /100 | #293 | Tragic 26.5% |
| Latvians | 0.1 /100 | #294 | Tragic 26.4% |
| Macedonians | 0.1 /100 | #295 | Tragic 26.4% |
| Croatians | 0.1 /100 | #296 | Tragic 26.4% |
| Armenians | 0.1 /100 | #297 | Tragic 26.4% |
| Immigrants | Western Europe | 0.1 /100 | #298 | Tragic 26.4% |
| Trinidadians and Tobagonians | 0.1 /100 | #299 | Tragic 26.4% |
| Paiute | 0.1 /100 | #300 | Tragic 26.4% |
Demographics Similar to Welsh by Family Households with Children
In terms of family households with children, the demographic groups most similar to Welsh are Immigrants from Ukraine (27.2%, a difference of 0.010%), Immigrants from Dominica (27.2%, a difference of 0.010%), Okinawan (27.2%, a difference of 0.020%), African (27.2%, a difference of 0.060%), and Northern European (27.2%, a difference of 0.060%).
| Demographics | Rating | Rank | Family Households with Children |
| Immigrants | Sudan | 21.6 /100 | #204 | Fair 27.3% |
| Immigrants | Haiti | 20.3 /100 | #205 | Fair 27.2% |
| Immigrants | Micronesia | 20.2 /100 | #206 | Fair 27.2% |
| Haitians | 19.8 /100 | #207 | Poor 27.2% |
| Immigrants | Poland | 16.4 /100 | #208 | Poor 27.2% |
| Dutch West Indians | 15.8 /100 | #209 | Poor 27.2% |
| Immigrants | Ukraine | 14.4 /100 | #210 | Poor 27.2% |
| Welsh | 14.2 /100 | #211 | Poor 27.2% |
| Immigrants | Dominica | 13.9 /100 | #212 | Poor 27.2% |
| Okinawans | 13.7 /100 | #213 | Poor 27.2% |
| Africans | 13.0 /100 | #214 | Poor 27.2% |
| Northern Europeans | 12.8 /100 | #215 | Poor 27.2% |
| Cubans | 12.2 /100 | #216 | Poor 27.1% |
| U.S. Virgin Islanders | 12.1 /100 | #217 | Poor 27.1% |
| Greeks | 11.4 /100 | #218 | Poor 27.1% |