Basque vs Scottish Married-couple Households
COMPARE
Basque
Scottish
Married-couple Households
Married-couple Households Comparison
Basques
Scottish
48.4%
MARRIED-COUPLE HOUSEHOLDS
99.0/ 100
METRIC RATING
63rd/ 347
METRIC RANK
49.0%
MARRIED-COUPLE HOUSEHOLDS
99.7/ 100
METRIC RATING
35th/ 347
METRIC RANK
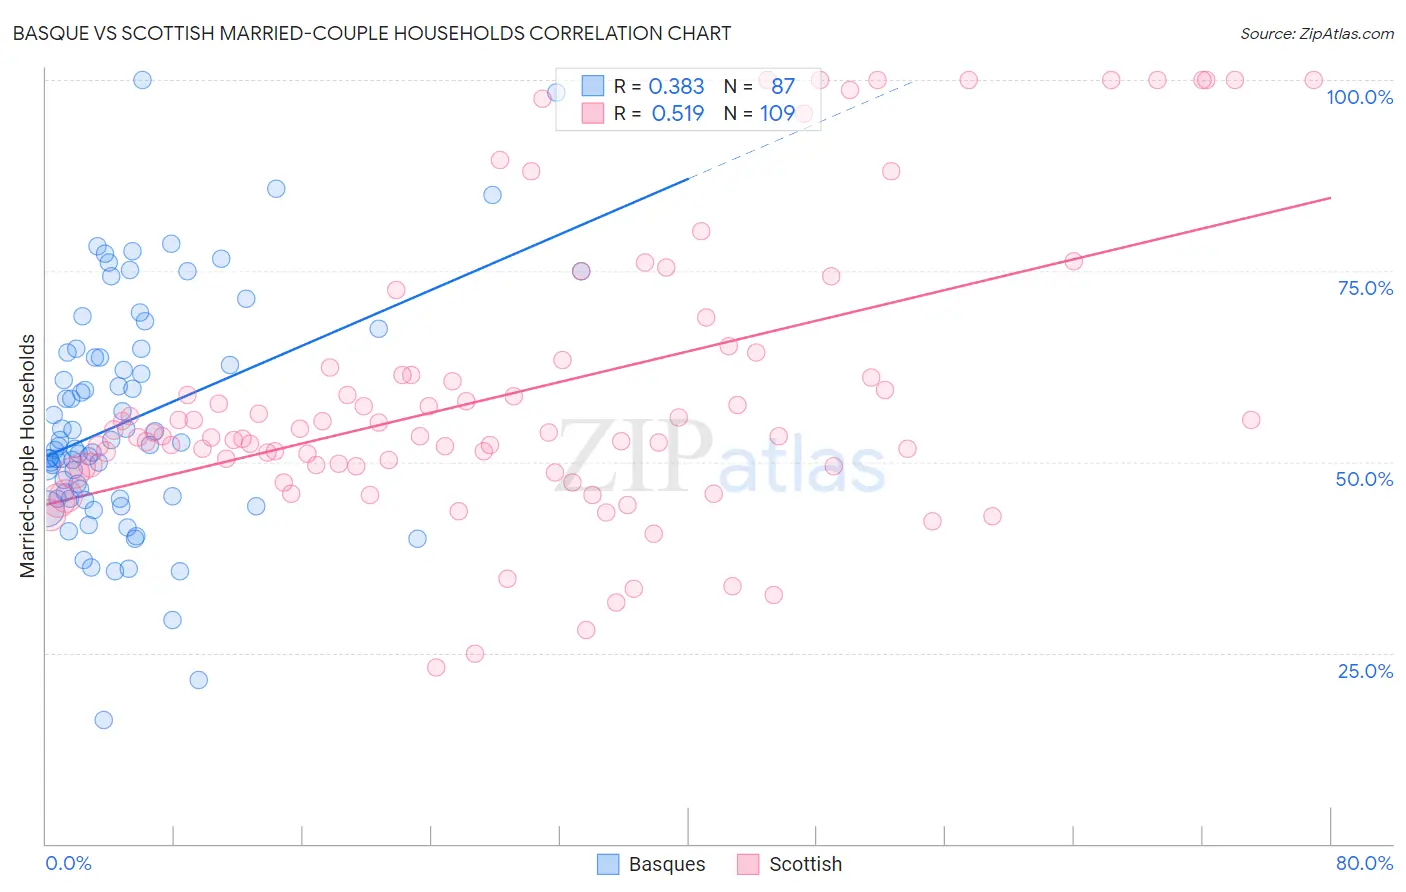
Basque vs Scottish Married-couple Households Correlation Chart
The statistical analysis conducted on geographies consisting of 165,752,424 people shows a mild positive correlation between the proportion of Basques and percentage of married-couple family households in the United States with a correlation coefficient (R) of 0.383 and weighted average of 48.4%. Similarly, the statistical analysis conducted on geographies consisting of 566,528,942 people shows a substantial positive correlation between the proportion of Scottish and percentage of married-couple family households in the United States with a correlation coefficient (R) of 0.519 and weighted average of 49.0%, a difference of 1.2%.
Married-couple Households Correlation Summary
| Measurement | Basque | Scottish |
| Minimum | 16.3% | 23.1% |
| Maximum | 100.0% | 100.0% |
| Range | 83.7% | 76.9% |
| Mean | 55.5% | 59.2% |
| Median | 52.2% | 53.4% |
| Interquartile 25% (IQ1) | 45.2% | 49.4% |
| Interquartile 75% (IQ3) | 64.3% | 62.9% |
| Interquartile Range (IQR) | 19.1% | 13.5% |
| Standard Deviation (Sample) | 15.2% | 18.8% |
| Standard Deviation (Population) | 15.1% | 18.7% |
Similar Demographics by Married-couple Households
Demographics Similar to Basques by Married-couple Households
In terms of married-couple households, the demographic groups most similar to Basques are Northern European (48.4%, a difference of 0.010%), Immigrants from Canada (48.4%, a difference of 0.030%), Jordanian (48.4%, a difference of 0.050%), Luxembourger (48.5%, a difference of 0.060%), and Romanian (48.4%, a difference of 0.060%).
| Demographics | Rating | Rank | Married-couple Households |
| Immigrants | Northern Europe | 99.3 /100 | #56 | Exceptional 48.6% |
| Poles | 99.2 /100 | #57 | Exceptional 48.5% |
| Immigrants | Indonesia | 99.2 /100 | #58 | Exceptional 48.5% |
| Czechoslovakians | 99.2 /100 | #59 | Exceptional 48.5% |
| Croatians | 99.1 /100 | #60 | Exceptional 48.5% |
| Bulgarians | 99.1 /100 | #61 | Exceptional 48.5% |
| Luxembourgers | 99.1 /100 | #62 | Exceptional 48.5% |
| Basques | 99.0 /100 | #63 | Exceptional 48.4% |
| Northern Europeans | 99.0 /100 | #64 | Exceptional 48.4% |
| Immigrants | Canada | 99.0 /100 | #65 | Exceptional 48.4% |
| Jordanians | 98.9 /100 | #66 | Exceptional 48.4% |
| Romanians | 98.9 /100 | #67 | Exceptional 48.4% |
| Immigrants | South Eastern Asia | 98.9 /100 | #68 | Exceptional 48.4% |
| Immigrants | China | 98.9 /100 | #69 | Exceptional 48.4% |
| Immigrants | North America | 98.9 /100 | #70 | Exceptional 48.4% |
Demographics Similar to Scottish by Married-couple Households
In terms of married-couple households, the demographic groups most similar to Scottish are Italian (49.0%, a difference of 0.020%), Iranian (49.0%, a difference of 0.090%), Sri Lankan (49.0%, a difference of 0.090%), Immigrants from Asia (49.1%, a difference of 0.10%), and Hungarian (49.1%, a difference of 0.13%).
| Demographics | Rating | Rank | Married-couple Households |
| Germans | 99.8 /100 | #28 | Exceptional 49.2% |
| Maltese | 99.8 /100 | #29 | Exceptional 49.2% |
| Bolivians | 99.8 /100 | #30 | Exceptional 49.2% |
| Native Hawaiians | 99.8 /100 | #31 | Exceptional 49.1% |
| Hungarians | 99.8 /100 | #32 | Exceptional 49.1% |
| Immigrants | Asia | 99.7 /100 | #33 | Exceptional 49.1% |
| Italians | 99.7 /100 | #34 | Exceptional 49.0% |
| Scottish | 99.7 /100 | #35 | Exceptional 49.0% |
| Iranians | 99.7 /100 | #36 | Exceptional 49.0% |
| Sri Lankans | 99.7 /100 | #37 | Exceptional 49.0% |
| Greeks | 99.7 /100 | #38 | Exceptional 48.9% |
| Lithuanians | 99.6 /100 | #39 | Exceptional 48.9% |
| Immigrants | Bolivia | 99.6 /100 | #40 | Exceptional 48.9% |
| Immigrants | Lebanon | 99.6 /100 | #41 | Exceptional 48.9% |
| Immigrants | Vietnam | 99.6 /100 | #42 | Exceptional 48.8% |