Basque vs Cheyenne Married-couple Households
COMPARE
Basque
Cheyenne
Married-couple Households
Married-couple Households Comparison
Basques
Cheyenne
48.4%
MARRIED-COUPLE HOUSEHOLDS
99.0/ 100
METRIC RATING
63rd/ 347
METRIC RANK
42.3%
MARRIED-COUPLE HOUSEHOLDS
0.0/ 100
METRIC RATING
284th/ 347
METRIC RANK
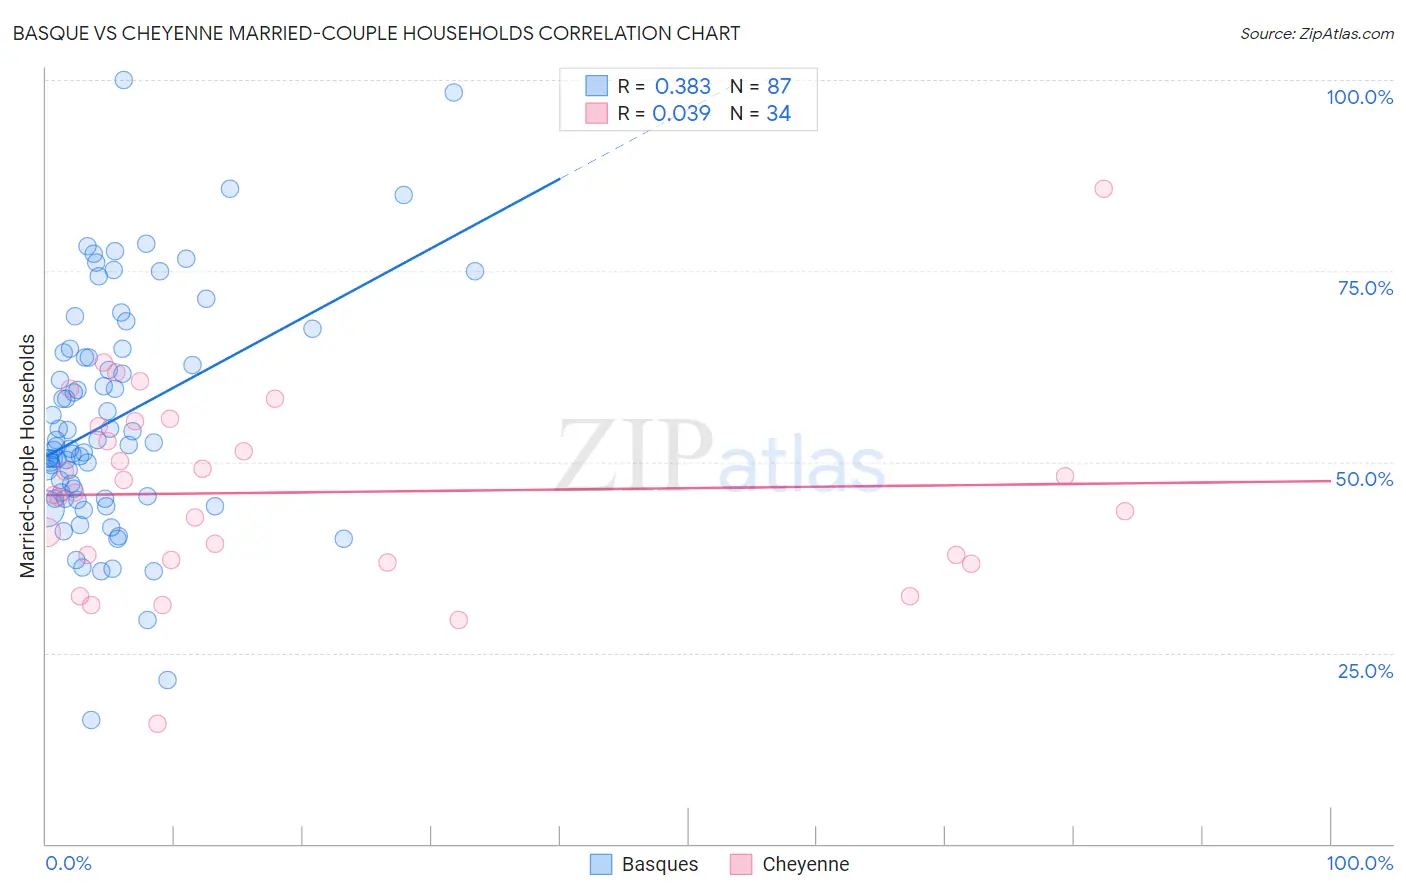
Basque vs Cheyenne Married-couple Households Correlation Chart
The statistical analysis conducted on geographies consisting of 165,752,424 people shows a mild positive correlation between the proportion of Basques and percentage of married-couple family households in the United States with a correlation coefficient (R) of 0.383 and weighted average of 48.4%. Similarly, the statistical analysis conducted on geographies consisting of 80,704,994 people shows no correlation between the proportion of Cheyenne and percentage of married-couple family households in the United States with a correlation coefficient (R) of 0.039 and weighted average of 42.3%, a difference of 14.7%.
Married-couple Households Correlation Summary
| Measurement | Basque | Cheyenne |
| Minimum | 16.3% | 15.8% |
| Maximum | 100.0% | 85.7% |
| Range | 83.7% | 69.9% |
| Mean | 55.5% | 46.0% |
| Median | 52.2% | 45.8% |
| Interquartile 25% (IQ1) | 45.2% | 37.1% |
| Interquartile 75% (IQ3) | 64.3% | 54.6% |
| Interquartile Range (IQR) | 19.1% | 17.5% |
| Standard Deviation (Sample) | 15.2% | 12.9% |
| Standard Deviation (Population) | 15.1% | 12.7% |
Similar Demographics by Married-couple Households
Demographics Similar to Basques by Married-couple Households
In terms of married-couple households, the demographic groups most similar to Basques are Northern European (48.4%, a difference of 0.010%), Immigrants from Canada (48.4%, a difference of 0.030%), Jordanian (48.4%, a difference of 0.050%), Luxembourger (48.5%, a difference of 0.060%), and Romanian (48.4%, a difference of 0.060%).
| Demographics | Rating | Rank | Married-couple Households |
| Immigrants | Northern Europe | 99.3 /100 | #56 | Exceptional 48.6% |
| Poles | 99.2 /100 | #57 | Exceptional 48.5% |
| Immigrants | Indonesia | 99.2 /100 | #58 | Exceptional 48.5% |
| Czechoslovakians | 99.2 /100 | #59 | Exceptional 48.5% |
| Croatians | 99.1 /100 | #60 | Exceptional 48.5% |
| Bulgarians | 99.1 /100 | #61 | Exceptional 48.5% |
| Luxembourgers | 99.1 /100 | #62 | Exceptional 48.5% |
| Basques | 99.0 /100 | #63 | Exceptional 48.4% |
| Northern Europeans | 99.0 /100 | #64 | Exceptional 48.4% |
| Immigrants | Canada | 99.0 /100 | #65 | Exceptional 48.4% |
| Jordanians | 98.9 /100 | #66 | Exceptional 48.4% |
| Romanians | 98.9 /100 | #67 | Exceptional 48.4% |
| Immigrants | South Eastern Asia | 98.9 /100 | #68 | Exceptional 48.4% |
| Immigrants | China | 98.9 /100 | #69 | Exceptional 48.4% |
| Immigrants | North America | 98.9 /100 | #70 | Exceptional 48.4% |
Demographics Similar to Cheyenne by Married-couple Households
In terms of married-couple households, the demographic groups most similar to Cheyenne are Ghanaian (42.2%, a difference of 0.030%), Belizean (42.2%, a difference of 0.040%), Chippewa (42.1%, a difference of 0.27%), Immigrants from Eritrea (42.1%, a difference of 0.35%), and Inupiat (42.4%, a difference of 0.36%).
| Demographics | Rating | Rank | Married-couple Households |
| Immigrants | Eastern Africa | 0.0 /100 | #277 | Tragic 42.9% |
| Immigrants | Africa | 0.0 /100 | #278 | Tragic 42.9% |
| Sierra Leoneans | 0.0 /100 | #279 | Tragic 42.9% |
| Immigrants | Ecuador | 0.0 /100 | #280 | Tragic 42.9% |
| Immigrants | Guatemala | 0.0 /100 | #281 | Tragic 42.8% |
| Bermudans | 0.0 /100 | #282 | Tragic 42.4% |
| Inupiat | 0.0 /100 | #283 | Tragic 42.4% |
| Cheyenne | 0.0 /100 | #284 | Tragic 42.3% |
| Ghanaians | 0.0 /100 | #285 | Tragic 42.2% |
| Belizeans | 0.0 /100 | #286 | Tragic 42.2% |
| Chippewa | 0.0 /100 | #287 | Tragic 42.1% |
| Immigrants | Eritrea | 0.0 /100 | #288 | Tragic 42.1% |
| Sudanese | 0.0 /100 | #289 | Tragic 42.1% |
| Hondurans | 0.0 /100 | #290 | Tragic 42.1% |
| Paiute | 0.0 /100 | #291 | Tragic 42.1% |