Assyrian/Chaldean/Syriac vs Immigrants from Bosnia and Herzegovina Births to Unmarried Women

COMPARE

Assyrian/Chaldean/Syriac
Race
Ancestry
AfghanAfricanAlaska NativeAlaskan AthabascanAlbanianAleutAlsatianAmericanApacheArabArapahoArgentineanArmenianAssyrian/Chaldean/SyriacAustralianAustrianBahamianBangladeshiBarbadianBasqueBelgianBelizeanBermudanBhutaneseBlackfeetBolivianBrazilianBritishBritish West IndianBulgarianBurmeseCajunCambodianCanadianCape VerdeanCarpatho RusynCelticCentral AmericanCentral American IndianCherokeeCheyenneChickasawChileanChineseChippewaChoctawColombianColvilleComancheCosta RicanCreeCreekCroatianCrowCubanCypriotCzechCzechoslovakianDanishDelawareDominicanDutchDutch West IndianEastern EuropeanEcuadorianEgyptianEnglishEstonianEthiopianEuropeanFijianFilipinoFinnishFrenchFrench American IndianFrench CanadianGermanGerman RussianGhanaianGreekGuamanian/ChamorroGuatemalanGuyaneseHaitianHmongHonduranHopiHoumaHungarianIcelanderIndian (Asian)IndonesianInupiatIranianIraqiIrishIroquoisIsraeliItalianJamaicanJapaneseJordanianKenyanKiowaKoreanLaotianLatvianLebaneseLiberianLithuanianLumbeeLuxembourgerMacedonianMalaysianMalteseMarshalleseMenomineeMexicanMexican American IndianMongolianMoroccanNative HawaiianNavajoNepaleseNew ZealanderNicaraguanNigerianNorthern EuropeanNorwegianOkinawanOsageOttawaPaiutePakistaniPalestinianPanamanianParaguayanPennsylvania GermanPeruvianPimaPolishPortuguesePotawatomiPuebloPuerto RicanPuget Sound SalishRomanianRussianSalvadoranSamoanScandinavianScotch-IrishScottishSeminoleSenegaleseSerbianShoshoneSierra LeoneanSiouxSlavicSlovakSloveneSomaliSouth AfricanSouth AmericanSouth American IndianSoviet UnionSpaniardSpanishSpanish AmericanSpanish American IndianSri LankanSubsaharan AfricanSudaneseSwedishSwissSyrianTaiwaneseThaiTlingit-HaidaTohono O'OdhamTonganTrinidadian and TobagonianTsimshianTurkishU.S. Virgin IslanderUgandanUkrainianUruguayanUteVenezuelanVietnameseWelshWest IndianYakamaYaquiYugoslavianYumanYup'ikZimbabwean
Immigration
NonimmigrantsImmigrantsAfghanistanAfricaAlbaniaArgentinaArmeniaAsiaAustraliaAustriaBahamasBangladeshBarbadosBelarusBelgiumBelizeBoliviaBrazilBulgariaBurma/MyanmarCabo VerdeCambodiaCameroonCanadaCaribbeanCentral AmericaChileChinaColombiaCongoCosta RicaCroatiaCubaCzechoslovakiaDenmarkDominicaDominican RepublicEastern AfricaEastern AsiaEastern EuropeEcuadorEgyptEl SalvadorEnglandEritreaEthiopiaEuropeFijiFranceGermanyGhanaGreeceGrenadaGuatemalaGuyanaHaitiHondurasHong KongHungaryIndiaIndonesiaIranIraqIrelandIsraelItalyJamaicaJapanJordanKazakhstanKenyaKoreaKuwaitLaosLatin AmericaLatviaLebanonLiberiaLithuaniaMalaysiaMexicoMicronesiaMiddle AfricaMoldovaMoroccoNepalNetherlandsNicaraguaNigeriaNorth AmericaNorth MacedoniaNorthern AfricaNorthern EuropeNorwayOceaniaPakistanPanamaPeruPhilippinesPolandPortugalRomaniaRussiaSaudi ArabiaScotlandSenegalSerbiaSierra LeoneSingaporeSomaliaSouth AfricaSouth AmericaSouth Central AsiaSouth Eastern AsiaSouthern EuropeSpainSri LankaSt. Vincent and the GrenadinesSudanSwedenSwitzerlandSyriaTaiwanThailandTrinidad and TobagoTurkeyUgandaUkraineUruguayUzbekistanVenezuelaVietnamWest IndiesWestern AfricaWestern AsiaWestern EuropeYemenZaireZimbabweAzores
Immigrants from Bosnia and Herzegovina
Race
Ancestry
AfghanAfricanAlaska NativeAlaskan AthabascanAlbanianAleutAlsatianAmericanApacheArabArapahoArgentineanArmenianAustralianAustrianBahamianBangladeshiBarbadianBasqueBelgianBelizeanBermudanBhutaneseBlackfeetBolivianBrazilianBritishBritish West IndianBulgarianBurmeseCajunCambodianCanadianCape VerdeanCarpatho RusynCelticCentral AmericanCentral American IndianCherokeeCheyenneChickasawChileanChineseChippewaChoctawColombianColvilleComancheCosta RicanCreeCreekCroatianCrowCubanCypriotCzechCzechoslovakianDanishDelawareDominicanDutchDutch West IndianEastern EuropeanEcuadorianEgyptianEnglishEstonianEthiopianEuropeanFijianFilipinoFinnishFrenchFrench American IndianFrench CanadianGermanGerman RussianGhanaianGreekGuamanian/ChamorroGuatemalanGuyaneseHaitianHmongHonduranHopiHoumaHungarianIcelanderIndian (Asian)IndonesianInupiatIranianIraqiIrishIroquoisIsraeliItalianJamaicanJapaneseJordanianKenyanKiowaKoreanLaotianLatvianLebaneseLiberianLithuanianLumbeeLuxembourgerMacedonianMalaysianMalteseMarshalleseMenomineeMexicanMexican American IndianMongolianMoroccanNative HawaiianNavajoNepaleseNew ZealanderNicaraguanNigerianNorthern EuropeanNorwegianOkinawanOsageOttawaPaiutePakistaniPalestinianPanamanianParaguayanPennsylvania GermanPeruvianPimaPolishPortuguesePotawatomiPuebloPuerto RicanPuget Sound SalishRomanianRussianSalvadoranSamoanScandinavianScotch-IrishScottishSeminoleSenegaleseSerbianShoshoneSierra LeoneanSiouxSlavicSlovakSloveneSomaliSouth AfricanSouth AmericanSouth American IndianSoviet UnionSpaniardSpanishSpanish AmericanSpanish American IndianSri LankanSubsaharan AfricanSudaneseSwedishSwissSyrianTaiwaneseThaiTlingit-HaidaTohono O'OdhamTonganTrinidadian and TobagonianTsimshianTurkishU.S. Virgin IslanderUgandanUkrainianUruguayanUteVenezuelanVietnameseWelshWest IndianYakamaYaquiYugoslavianYumanYup'ikZimbabwean
Immigration
NonimmigrantsImmigrantsAfghanistanAfricaAlbaniaArgentinaArmeniaAsiaAustraliaAustriaBahamasBangladeshBarbadosBelarusBelgiumBelizeBoliviaBosnia and HerzegovinaBrazilBulgariaBurma/MyanmarCabo VerdeCambodiaCameroonCanadaCaribbeanCentral AmericaChileChinaColombiaCongoCosta RicaCroatiaCubaCzechoslovakiaDenmarkDominicaDominican RepublicEastern AfricaEastern AsiaEastern EuropeEcuadorEgyptEl SalvadorEnglandEritreaEthiopiaEuropeFijiFranceGermanyGhanaGreeceGrenadaGuatemalaGuyanaHaitiHondurasHong KongHungaryIndiaIndonesiaIranIraqIrelandIsraelItalyJamaicaJapanJordanKazakhstanKenyaKoreaKuwaitLaosLatin AmericaLatviaLebanonLiberiaLithuaniaMalaysiaMexicoMicronesiaMiddle AfricaMoldovaMoroccoNepalNetherlandsNicaraguaNigeriaNorth AmericaNorth MacedoniaNorthern AfricaNorthern EuropeNorwayOceaniaPakistanPanamaPeruPhilippinesPolandPortugalRomaniaRussiaSaudi ArabiaScotlandSenegalSerbiaSierra LeoneSingaporeSomaliaSouth AfricaSouth AmericaSouth Central AsiaSouth Eastern AsiaSouthern EuropeSpainSri LankaSt. Vincent and the GrenadinesSudanSwedenSwitzerlandSyriaTaiwanThailandTrinidad and TobagoTurkeyUgandaUkraineUruguayUzbekistanVenezuelaVietnamWest IndiesWestern AfricaWestern AsiaWestern EuropeYemenZaireZimbabweAzores
Births to Unmarried Women
Income
Poverty
Unemployment
Labor Participation
Family Structure
Vehicle Availability
Education Level
Disability

Births to Unmarried Women Comparison

Assyrians/Chaldeans/Syriacs

Immigrants from Bosnia and Herzegovina

Exceptional
Excellent
22.0%
BIRTHS TO UNMARRIED WOMEN
100.0/ 100
METRIC RATING
1st/ 347
METRIC RANK
30.3%
BIRTHS TO UNMARRIED WOMEN
85.7/ 100
METRIC RATING
130th/ 347
METRIC RANK

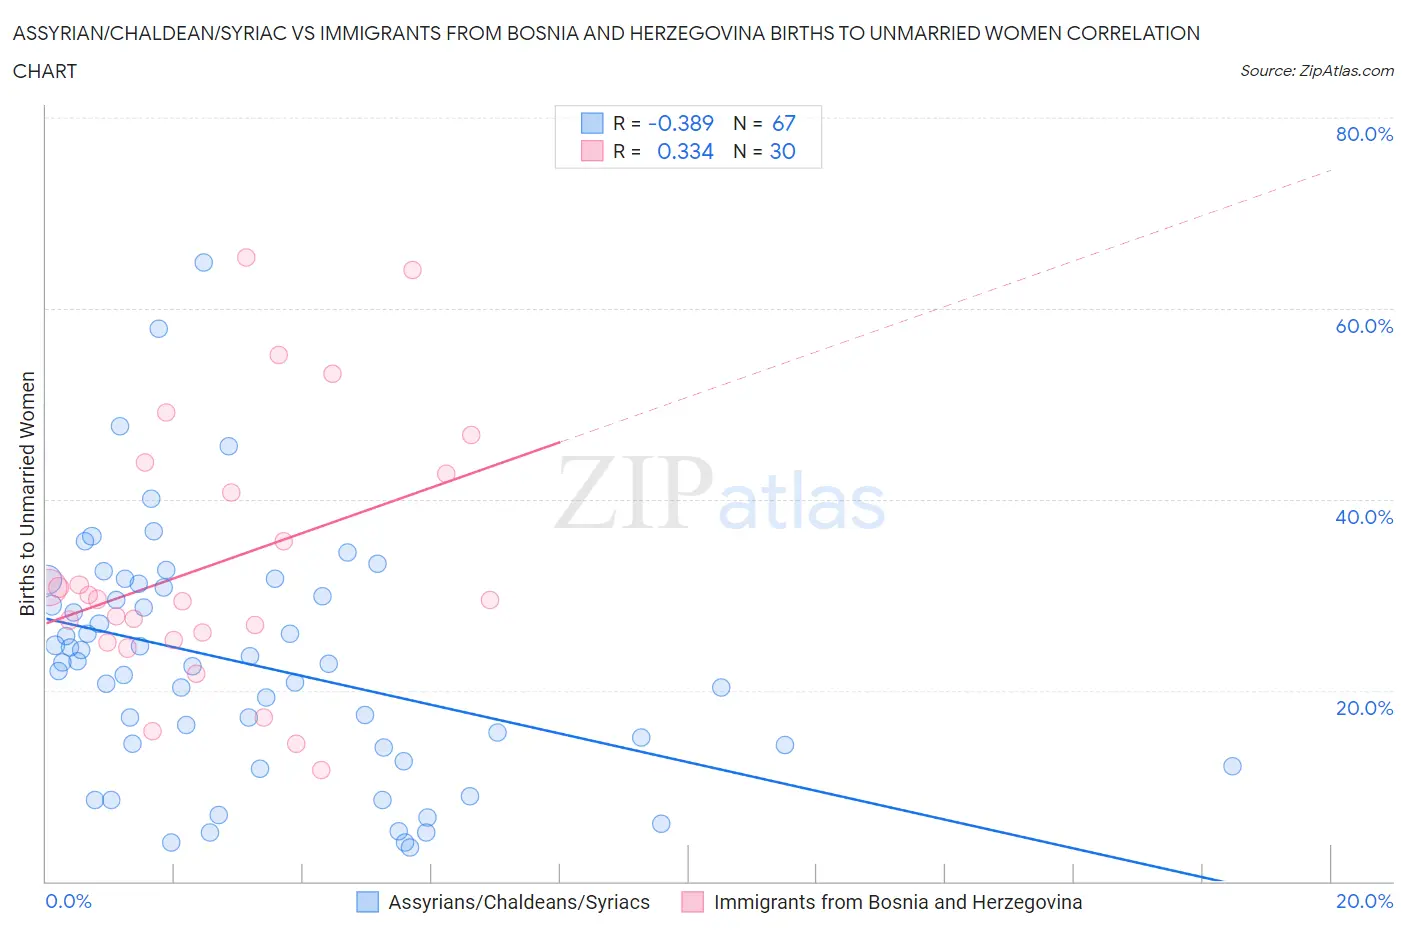
Assyrian/Chaldean/Syriac vs Immigrants from Bosnia and Herzegovina Births to Unmarried Women Correlation Chart

The statistical analysis conducted on geographies consisting of 106,724,446 people shows a mild negative correlation between the proportion of Assyrians/Chaldeans/Syriacs and percentage of births to unmarried women in the United States with a correlation coefficient (R) of -0.389 and weighted average of 22.0%. Similarly, the statistical analysis conducted on geographies consisting of 151,670,112 people shows a mild positive correlation between the proportion of Immigrants from Bosnia and Herzegovina and percentage of births to unmarried women in the United States with a correlation coefficient (R) of 0.334 and weighted average of 30.3%, a difference of 38.1%.
Assyrian/Chaldean/Syriac vs Immigrants from Bosnia and Herzegovina Births to Unmarried Women

Births to Unmarried Women Correlation Summary

MeasurementAssyrian/Chaldean/SyriacImmigrants from Bosnia and Herzegovina
Minimum3.5%11.7%
Maximum64.8%65.3%
Range61.3%53.6%
Mean22.7%33.3%
Median22.7%29.5%
Interquartile 25% (IQ1)14.0%25.3%
Interquartile 75% (IQ3)30.8%42.7%
Interquartile Range (IQR)16.8%17.4%
Standard Deviation (Sample)12.6%13.8%
Standard Deviation (Population)12.5%13.6%

Similar Demographics by Births to Unmarried Women

Demographics Similar to Assyrians/Chaldeans/Syriacs by Births to Unmarried Women

In terms of births to unmarried women, the demographic groups most similar to Assyrians/Chaldeans/Syriacs are Immigrants from India (22.9%, a difference of 4.2%), Filipino (23.0%, a difference of 4.6%), Immigrants from Taiwan (23.0%, a difference of 4.7%), Immigrants from Hong Kong (23.6%, a difference of 7.3%), and Immigrants from Iran (24.0%, a difference of 9.0%).
DemographicsRating | RankBirths to Unmarried Women
Assyrians/Chaldeans/Syriacs
100.0
/100
|
#1
Exceptional
22.0%
Immigrants | India
100.0
/100
|
#2
Exceptional
22.9%
Filipinos
100.0
/100
|
#3
Exceptional
23.0%
Immigrants | Taiwan
100.0
/100
|
#4
Exceptional
23.0%
Immigrants | Hong Kong
100.0
/100
|
#5
Exceptional
23.6%
Immigrants | Iran
100.0
/100
|
#6
Exceptional
24.0%
Thais
100.0
/100
|
#7
Exceptional
24.0%
Immigrants | China
100.0
/100
|
#8
Exceptional
24.7%
Immigrants | South Central Asia
100.0
/100
|
#9
Exceptional
24.7%
Immigrants | Eastern Asia
100.0
/100
|
#10
Exceptional
25.0%
Immigrants | Israel
100.0
/100
|
#11
Exceptional
25.1%
Indians (Asian)
100.0
/100
|
#12
Exceptional
25.3%
Iranians
100.0
/100
|
#13
Exceptional
25.3%
Immigrants | Lebanon
100.0
/100
|
#14
Exceptional
25.3%
Immigrants | Singapore
100.0
/100
|
#15
Exceptional
25.6%

Demographics Similar to Immigrants from Bosnia and Herzegovina by Births to Unmarried Women

In terms of births to unmarried women, the demographic groups most similar to Immigrants from Bosnia and Herzegovina are Immigrants from Spain (30.3%, a difference of 0.010%), Immigrants from Zimbabwe (30.3%, a difference of 0.010%), Icelander (30.3%, a difference of 0.050%), New Zealander (30.3%, a difference of 0.050%), and Immigrants from Morocco (30.4%, a difference of 0.090%).
DemographicsRating | RankBirths to Unmarried Women
Syrians
88.2
/100
|
#123
Excellent
30.2%
Croatians
88.0
/100
|
#124
Excellent
30.2%
Vietnamese
87.7
/100
|
#125
Excellent
30.2%
Europeans
87.2
/100
|
#126
Excellent
30.2%
Chinese
87.1
/100
|
#127
Excellent
30.2%
Icelanders
86.0
/100
|
#128
Excellent
30.3%
Immigrants | Spain
85.8
/100
|
#129
Excellent
30.3%
Immigrants | Bosnia and Herzegovina
85.7
/100
|
#130
Excellent
30.3%
Immigrants | Zimbabwe
85.7
/100
|
#131
Excellent
30.3%
New Zealanders
85.5
/100
|
#132
Excellent
30.3%
Immigrants | Morocco
85.2
/100
|
#133
Excellent
30.4%
Immigrants | South Eastern Asia
85.2
/100
|
#134
Excellent
30.4%
Brazilians
84.8
/100
|
#135
Excellent
30.4%
Immigrants | Scotland
84.6
/100
|
#136
Excellent
30.4%
Immigrants | Philippines
83.9
/100
|
#137
Excellent
30.4%