Assyrian/Chaldean/Syriac vs Argentinean Births to Unmarried Women
COMPARE
Assyrian/Chaldean/Syriac
Argentinean
Births to Unmarried Women
Births to Unmarried Women Comparison
Assyrians/Chaldeans/Syriacs
Argentineans
22.0%
BIRTHS TO UNMARRIED WOMEN
100.0/ 100
METRIC RATING
1st/ 347
METRIC RANK
30.0%
BIRTHS TO UNMARRIED WOMEN
90.5/ 100
METRIC RATING
119th/ 347
METRIC RANK
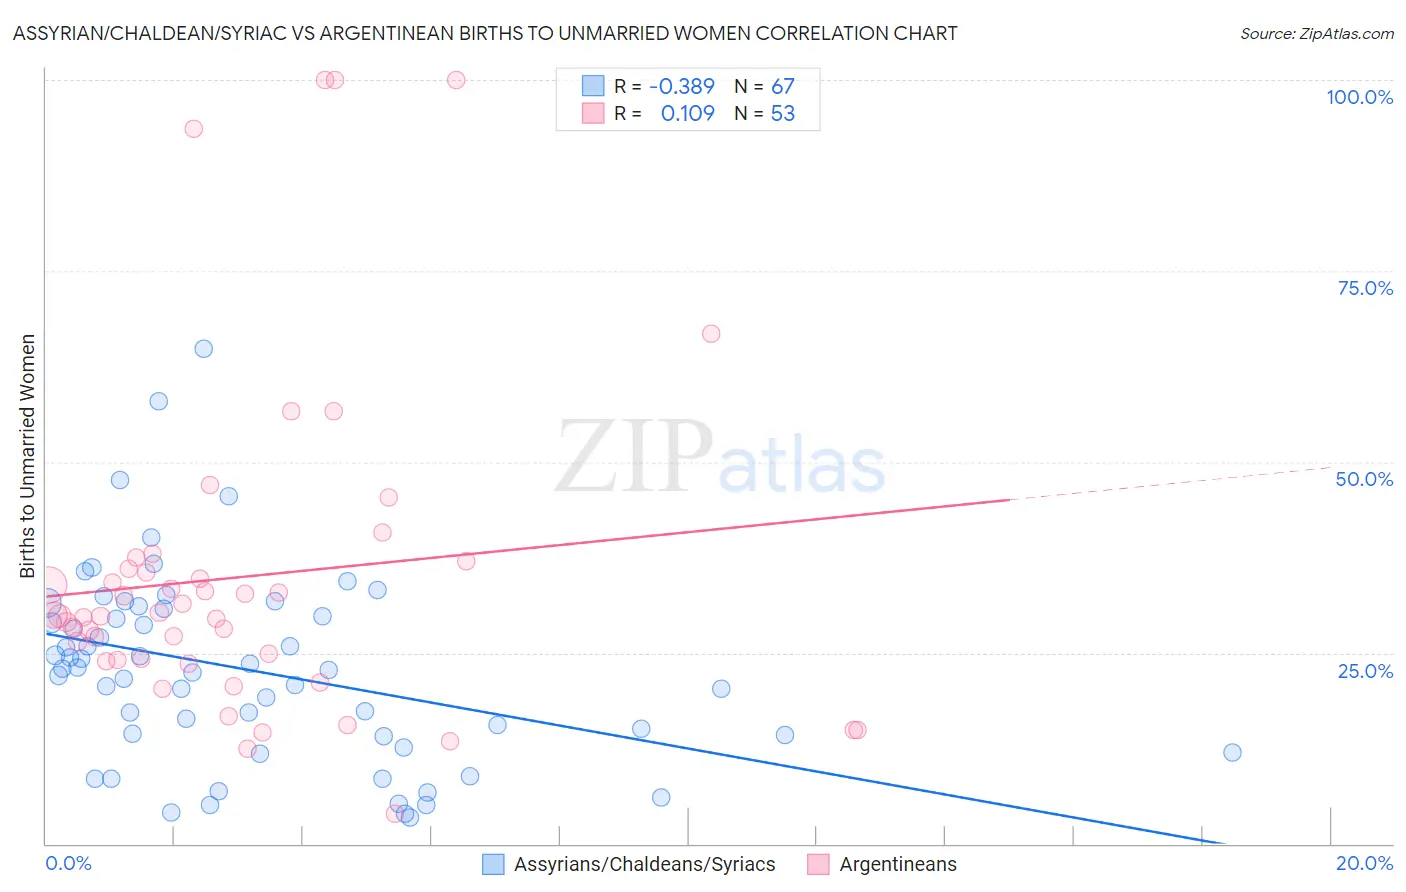
Assyrian/Chaldean/Syriac vs Argentinean Births to Unmarried Women Correlation Chart
The statistical analysis conducted on geographies consisting of 106,724,446 people shows a mild negative correlation between the proportion of Assyrians/Chaldeans/Syriacs and percentage of births to unmarried women in the United States with a correlation coefficient (R) of -0.389 and weighted average of 22.0%. Similarly, the statistical analysis conducted on geographies consisting of 280,462,153 people shows a poor positive correlation between the proportion of Argentineans and percentage of births to unmarried women in the United States with a correlation coefficient (R) of 0.109 and weighted average of 30.0%, a difference of 36.5%.
Births to Unmarried Women Correlation Summary
| Measurement | Assyrian/Chaldean/Syriac | Argentinean |
| Minimum | 3.5% | 4.0% |
| Maximum | 64.8% | 100.0% |
| Range | 61.3% | 96.0% |
| Mean | 22.7% | 34.9% |
| Median | 22.7% | 29.9% |
| Interquartile 25% (IQ1) | 14.0% | 24.0% |
| Interquartile 75% (IQ3) | 30.8% | 36.5% |
| Interquartile Range (IQR) | 16.8% | 12.5% |
| Standard Deviation (Sample) | 12.6% | 21.5% |
| Standard Deviation (Population) | 12.5% | 21.3% |
Similar Demographics by Births to Unmarried Women
Demographics Similar to Assyrians/Chaldeans/Syriacs by Births to Unmarried Women
In terms of births to unmarried women, the demographic groups most similar to Assyrians/Chaldeans/Syriacs are Immigrants from India (22.9%, a difference of 4.2%), Filipino (23.0%, a difference of 4.6%), Immigrants from Taiwan (23.0%, a difference of 4.7%), Immigrants from Hong Kong (23.6%, a difference of 7.3%), and Immigrants from Iran (24.0%, a difference of 9.0%).
| Demographics | Rating | Rank | Births to Unmarried Women |
| Assyrians/Chaldeans/Syriacs | 100.0 /100 | #1 | Exceptional 22.0% |
| Immigrants | India | 100.0 /100 | #2 | Exceptional 22.9% |
| Filipinos | 100.0 /100 | #3 | Exceptional 23.0% |
| Immigrants | Taiwan | 100.0 /100 | #4 | Exceptional 23.0% |
| Immigrants | Hong Kong | 100.0 /100 | #5 | Exceptional 23.6% |
| Immigrants | Iran | 100.0 /100 | #6 | Exceptional 24.0% |
| Thais | 100.0 /100 | #7 | Exceptional 24.0% |
| Immigrants | China | 100.0 /100 | #8 | Exceptional 24.7% |
| Immigrants | South Central Asia | 100.0 /100 | #9 | Exceptional 24.7% |
| Immigrants | Eastern Asia | 100.0 /100 | #10 | Exceptional 25.0% |
| Immigrants | Israel | 100.0 /100 | #11 | Exceptional 25.1% |
| Indians (Asian) | 100.0 /100 | #12 | Exceptional 25.3% |
| Iranians | 100.0 /100 | #13 | Exceptional 25.3% |
| Immigrants | Lebanon | 100.0 /100 | #14 | Exceptional 25.3% |
| Immigrants | Singapore | 100.0 /100 | #15 | Exceptional 25.6% |
Demographics Similar to Argentineans by Births to Unmarried Women
In terms of births to unmarried women, the demographic groups most similar to Argentineans are Immigrants from Norway (29.9%, a difference of 0.14%), Immigrants from Netherlands (29.9%, a difference of 0.16%), Ugandan (30.1%, a difference of 0.36%), Immigrants from Italy (29.9%, a difference of 0.37%), and Korean (30.1%, a difference of 0.44%).
| Demographics | Rating | Rank | Births to Unmarried Women |
| Basques | 93.0 /100 | #112 | Exceptional 29.7% |
| Scandinavians | 92.7 /100 | #113 | Exceptional 29.8% |
| Immigrants | Croatia | 92.6 /100 | #114 | Exceptional 29.8% |
| Ethiopians | 91.9 /100 | #115 | Exceptional 29.8% |
| Immigrants | Italy | 91.7 /100 | #116 | Exceptional 29.9% |
| Immigrants | Netherlands | 91.1 /100 | #117 | Exceptional 29.9% |
| Immigrants | Norway | 91.0 /100 | #118 | Exceptional 29.9% |
| Argentineans | 90.5 /100 | #119 | Exceptional 30.0% |
| Ugandans | 89.2 /100 | #120 | Excellent 30.1% |
| Koreans | 88.9 /100 | #121 | Excellent 30.1% |
| Immigrants | Argentina | 88.7 /100 | #122 | Excellent 30.1% |
| Syrians | 88.2 /100 | #123 | Excellent 30.2% |
| Croatians | 88.0 /100 | #124 | Excellent 30.2% |
| Vietnamese | 87.7 /100 | #125 | Excellent 30.2% |
| Europeans | 87.2 /100 | #126 | Excellent 30.2% |