Assyrian/Chaldean/Syriac vs Alaskan Athabascan Births to Unmarried Women
COMPARE
Assyrian/Chaldean/Syriac
Alaskan Athabascan
Births to Unmarried Women
Births to Unmarried Women Comparison
Assyrians/Chaldeans/Syriacs
Alaskan Athabascans
22.0%
BIRTHS TO UNMARRIED WOMEN
100.0/ 100
METRIC RATING
1st/ 347
METRIC RANK
37.7%
BIRTHS TO UNMARRIED WOMEN
0.0/ 100
METRIC RATING
289th/ 347
METRIC RANK
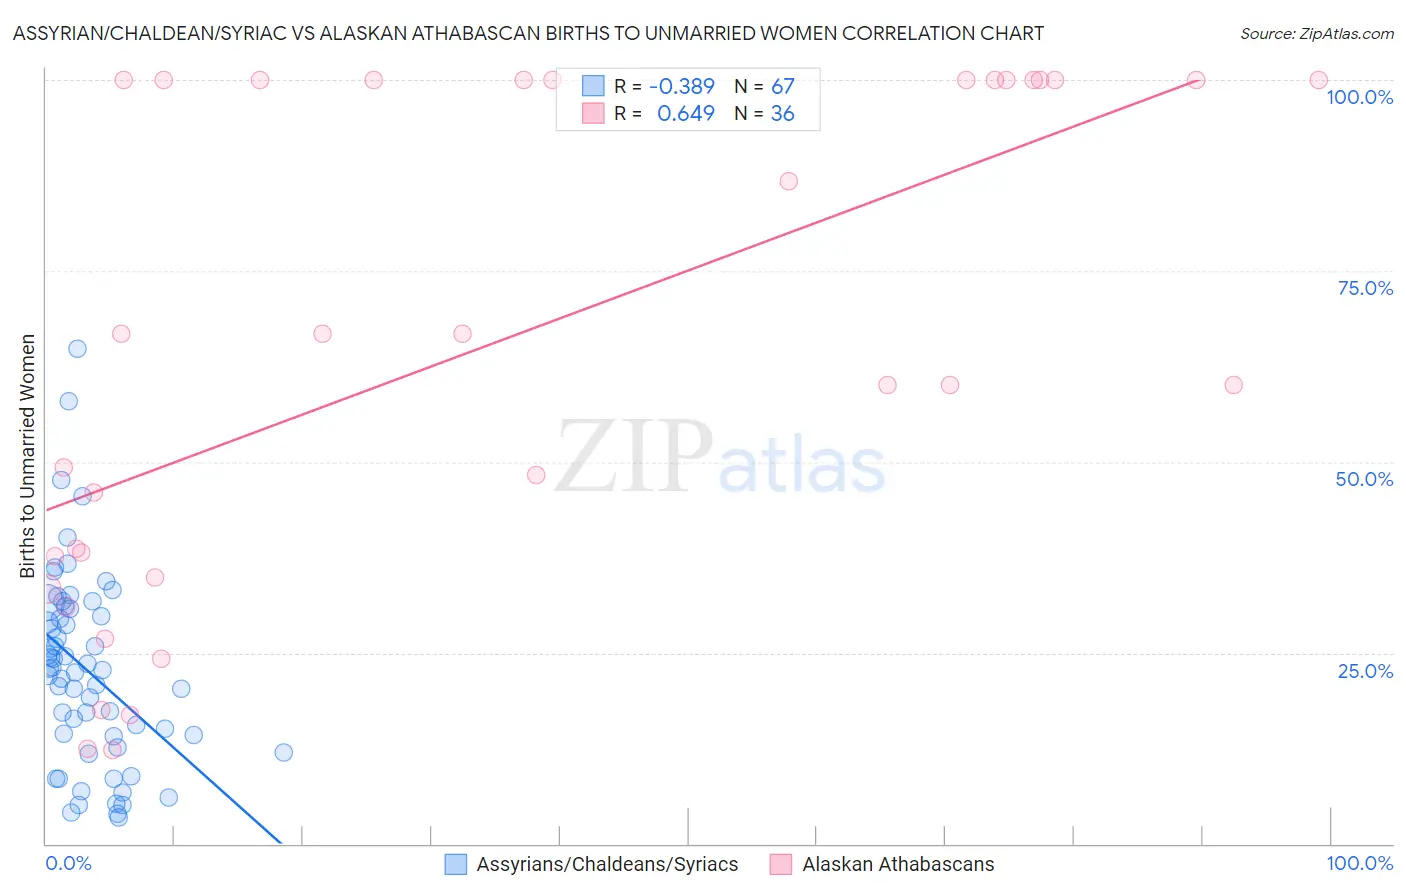
Assyrian/Chaldean/Syriac vs Alaskan Athabascan Births to Unmarried Women Correlation Chart
The statistical analysis conducted on geographies consisting of 106,724,446 people shows a mild negative correlation between the proportion of Assyrians/Chaldeans/Syriacs and percentage of births to unmarried women in the United States with a correlation coefficient (R) of -0.389 and weighted average of 22.0%. Similarly, the statistical analysis conducted on geographies consisting of 44,775,598 people shows a significant positive correlation between the proportion of Alaskan Athabascans and percentage of births to unmarried women in the United States with a correlation coefficient (R) of 0.649 and weighted average of 37.7%, a difference of 71.7%.
Births to Unmarried Women Correlation Summary
| Measurement | Assyrian/Chaldean/Syriac | Alaskan Athabascan |
| Minimum | 3.5% | 12.2% |
| Maximum | 64.8% | 100.0% |
| Range | 61.3% | 87.8% |
| Mean | 22.7% | 64.8% |
| Median | 22.7% | 63.4% |
| Interquartile 25% (IQ1) | 14.0% | 36.2% |
| Interquartile 75% (IQ3) | 30.8% | 100.0% |
| Interquartile Range (IQR) | 16.8% | 63.8% |
| Standard Deviation (Sample) | 12.6% | 32.5% |
| Standard Deviation (Population) | 12.5% | 32.1% |
Similar Demographics by Births to Unmarried Women
Demographics Similar to Assyrians/Chaldeans/Syriacs by Births to Unmarried Women
In terms of births to unmarried women, the demographic groups most similar to Assyrians/Chaldeans/Syriacs are Immigrants from India (22.9%, a difference of 4.2%), Filipino (23.0%, a difference of 4.6%), Immigrants from Taiwan (23.0%, a difference of 4.7%), Immigrants from Hong Kong (23.6%, a difference of 7.3%), and Immigrants from Iran (24.0%, a difference of 9.0%).
| Demographics | Rating | Rank | Births to Unmarried Women |
| Assyrians/Chaldeans/Syriacs | 100.0 /100 | #1 | Exceptional 22.0% |
| Immigrants | India | 100.0 /100 | #2 | Exceptional 22.9% |
| Filipinos | 100.0 /100 | #3 | Exceptional 23.0% |
| Immigrants | Taiwan | 100.0 /100 | #4 | Exceptional 23.0% |
| Immigrants | Hong Kong | 100.0 /100 | #5 | Exceptional 23.6% |
| Immigrants | Iran | 100.0 /100 | #6 | Exceptional 24.0% |
| Thais | 100.0 /100 | #7 | Exceptional 24.0% |
| Immigrants | China | 100.0 /100 | #8 | Exceptional 24.7% |
| Immigrants | South Central Asia | 100.0 /100 | #9 | Exceptional 24.7% |
| Immigrants | Eastern Asia | 100.0 /100 | #10 | Exceptional 25.0% |
| Immigrants | Israel | 100.0 /100 | #11 | Exceptional 25.1% |
| Indians (Asian) | 100.0 /100 | #12 | Exceptional 25.3% |
| Iranians | 100.0 /100 | #13 | Exceptional 25.3% |
| Immigrants | Lebanon | 100.0 /100 | #14 | Exceptional 25.3% |
| Immigrants | Singapore | 100.0 /100 | #15 | Exceptional 25.6% |
Demographics Similar to Alaskan Athabascans by Births to Unmarried Women
In terms of births to unmarried women, the demographic groups most similar to Alaskan Athabascans are Hispanic or Latino (37.8%, a difference of 0.14%), Immigrants from Liberia (37.6%, a difference of 0.23%), Creek (37.6%, a difference of 0.40%), Seminole (37.9%, a difference of 0.48%), and Blackfeet (37.9%, a difference of 0.52%).
| Demographics | Rating | Rank | Births to Unmarried Women |
| Liberians | 0.0 /100 | #282 | Tragic 37.4% |
| Spanish American Indians | 0.0 /100 | #283 | Tragic 37.4% |
| Immigrants | Central America | 0.0 /100 | #284 | Tragic 37.4% |
| Immigrants | Mexico | 0.0 /100 | #285 | Tragic 37.5% |
| Immigrants | Guatemala | 0.0 /100 | #286 | Tragic 37.5% |
| Creek | 0.0 /100 | #287 | Tragic 37.6% |
| Immigrants | Liberia | 0.0 /100 | #288 | Tragic 37.6% |
| Alaskan Athabascans | 0.0 /100 | #289 | Tragic 37.7% |
| Hispanics or Latinos | 0.0 /100 | #290 | Tragic 37.8% |
| Seminole | 0.0 /100 | #291 | Tragic 37.9% |
| Blackfeet | 0.0 /100 | #292 | Tragic 37.9% |
| Immigrants | Nicaragua | 0.0 /100 | #293 | Tragic 38.0% |
| British West Indians | 0.0 /100 | #294 | Tragic 38.0% |
| Iroquois | 0.0 /100 | #295 | Tragic 38.2% |
| Alaska Natives | 0.0 /100 | #296 | Tragic 38.3% |