Malaysian vs Argentinean Births to Unmarried Women
COMPARE
Malaysian
Argentinean
Births to Unmarried Women
Births to Unmarried Women Comparison
Malaysians
Argentineans
33.9%
BIRTHS TO UNMARRIED WOMEN
5.0/ 100
METRIC RATING
221st/ 347
METRIC RANK
30.0%
BIRTHS TO UNMARRIED WOMEN
90.5/ 100
METRIC RATING
119th/ 347
METRIC RANK
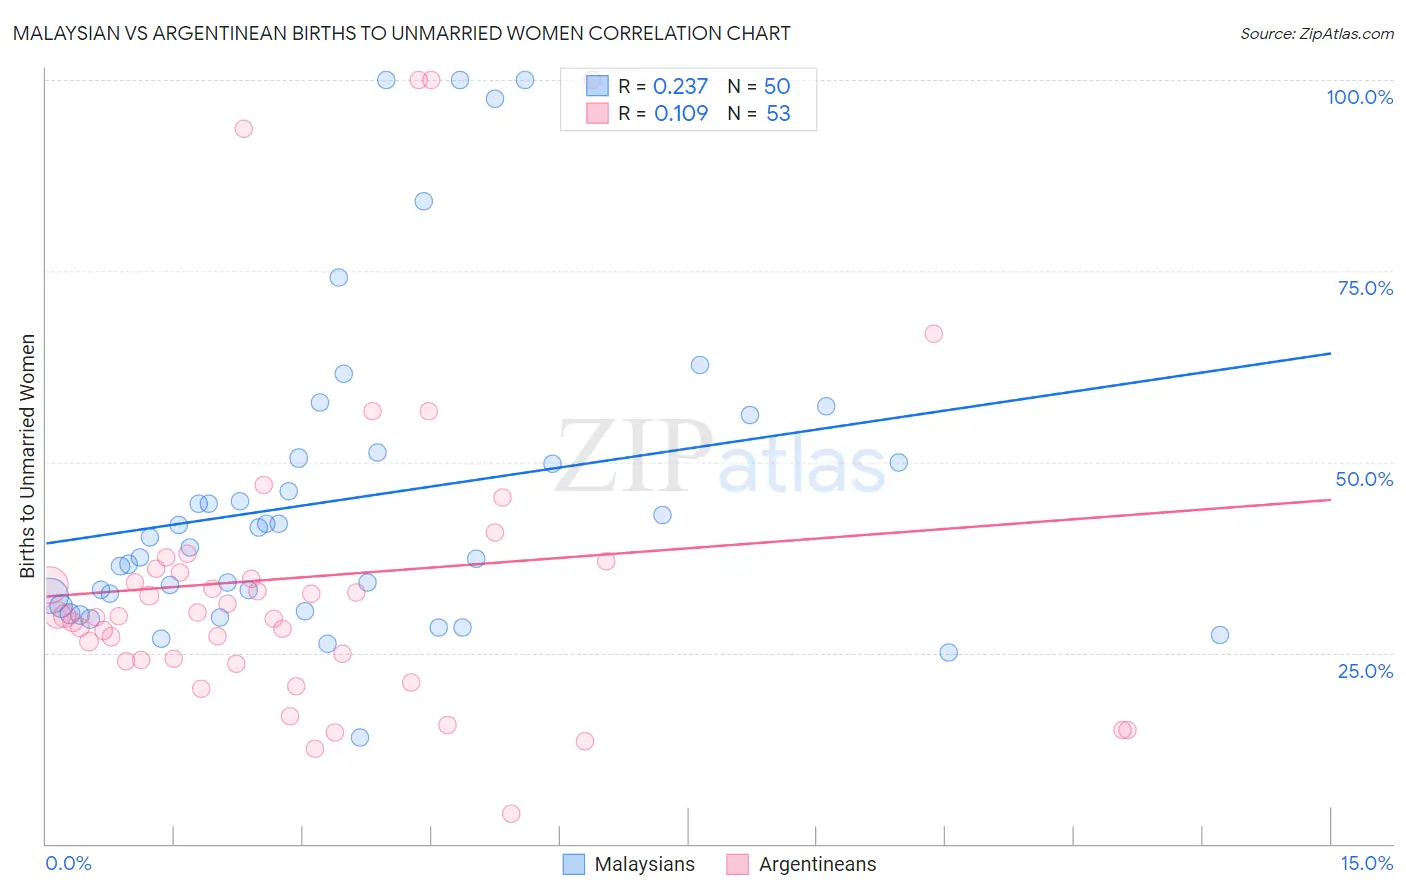
Malaysian vs Argentinean Births to Unmarried Women Correlation Chart
The statistical analysis conducted on geographies consisting of 219,699,687 people shows a weak positive correlation between the proportion of Malaysians and percentage of births to unmarried women in the United States with a correlation coefficient (R) of 0.237 and weighted average of 33.9%. Similarly, the statistical analysis conducted on geographies consisting of 280,462,153 people shows a poor positive correlation between the proportion of Argentineans and percentage of births to unmarried women in the United States with a correlation coefficient (R) of 0.109 and weighted average of 30.0%, a difference of 13.0%.
Births to Unmarried Women Correlation Summary
| Measurement | Malaysian | Argentinean |
| Minimum | 13.9% | 4.0% |
| Maximum | 100.0% | 100.0% |
| Range | 86.1% | 96.0% |
| Mean | 45.2% | 34.9% |
| Median | 39.4% | 29.9% |
| Interquartile 25% (IQ1) | 31.1% | 24.0% |
| Interquartile 75% (IQ3) | 50.5% | 36.5% |
| Interquartile Range (IQR) | 19.4% | 12.5% |
| Standard Deviation (Sample) | 20.7% | 21.5% |
| Standard Deviation (Population) | 20.4% | 21.3% |
Similar Demographics by Births to Unmarried Women
Demographics Similar to Malaysians by Births to Unmarried Women
In terms of births to unmarried women, the demographic groups most similar to Malaysians are Immigrants from Uruguay (33.9%, a difference of 0.060%), Portuguese (33.8%, a difference of 0.17%), Alsatian (33.8%, a difference of 0.19%), Pennsylvania German (34.0%, a difference of 0.35%), and Immigrants from Laos (34.0%, a difference of 0.36%).
| Demographics | Rating | Rank | Births to Unmarried Women |
| Slovaks | 9.3 /100 | #214 | Tragic 33.4% |
| French | 8.7 /100 | #215 | Tragic 33.4% |
| Nepalese | 7.8 /100 | #216 | Tragic 33.5% |
| Spaniards | 7.0 /100 | #217 | Tragic 33.6% |
| Immigrants | Ecuador | 5.9 /100 | #218 | Tragic 33.7% |
| Alsatians | 5.4 /100 | #219 | Tragic 33.8% |
| Portuguese | 5.4 /100 | #220 | Tragic 33.8% |
| Malaysians | 5.0 /100 | #221 | Tragic 33.9% |
| Immigrants | Uruguay | 4.8 /100 | #222 | Tragic 33.9% |
| Pennsylvania Germans | 4.3 /100 | #223 | Tragic 34.0% |
| Immigrants | Laos | 4.3 /100 | #224 | Tragic 34.0% |
| Spanish | 4.0 /100 | #225 | Tragic 34.1% |
| Delaware | 3.3 /100 | #226 | Tragic 34.2% |
| Immigrants | Panama | 3.3 /100 | #227 | Tragic 34.2% |
| Panamanians | 3.3 /100 | #228 | Tragic 34.2% |
Demographics Similar to Argentineans by Births to Unmarried Women
In terms of births to unmarried women, the demographic groups most similar to Argentineans are Immigrants from Norway (29.9%, a difference of 0.14%), Immigrants from Netherlands (29.9%, a difference of 0.16%), Ugandan (30.1%, a difference of 0.36%), Immigrants from Italy (29.9%, a difference of 0.37%), and Korean (30.1%, a difference of 0.44%).
| Demographics | Rating | Rank | Births to Unmarried Women |
| Basques | 93.0 /100 | #112 | Exceptional 29.7% |
| Scandinavians | 92.7 /100 | #113 | Exceptional 29.8% |
| Immigrants | Croatia | 92.6 /100 | #114 | Exceptional 29.8% |
| Ethiopians | 91.9 /100 | #115 | Exceptional 29.8% |
| Immigrants | Italy | 91.7 /100 | #116 | Exceptional 29.9% |
| Immigrants | Netherlands | 91.1 /100 | #117 | Exceptional 29.9% |
| Immigrants | Norway | 91.0 /100 | #118 | Exceptional 29.9% |
| Argentineans | 90.5 /100 | #119 | Exceptional 30.0% |
| Ugandans | 89.2 /100 | #120 | Excellent 30.1% |
| Koreans | 88.9 /100 | #121 | Excellent 30.1% |
| Immigrants | Argentina | 88.7 /100 | #122 | Excellent 30.1% |
| Syrians | 88.2 /100 | #123 | Excellent 30.2% |
| Croatians | 88.0 /100 | #124 | Excellent 30.2% |
| Vietnamese | 87.7 /100 | #125 | Excellent 30.2% |
| Europeans | 87.2 /100 | #126 | Excellent 30.2% |