Yuman vs Immigrants from Middle Africa 5th Grade
COMPARE
Yuman
Immigrants from Middle Africa
5th Grade
5th Grade Comparison
Yuman
Immigrants from Middle Africa
97.0%
5TH GRADE
4.5/ 100
METRIC RATING
229th/ 347
METRIC RANK
96.8%
5TH GRADE
0.8/ 100
METRIC RATING
253rd/ 347
METRIC RANK
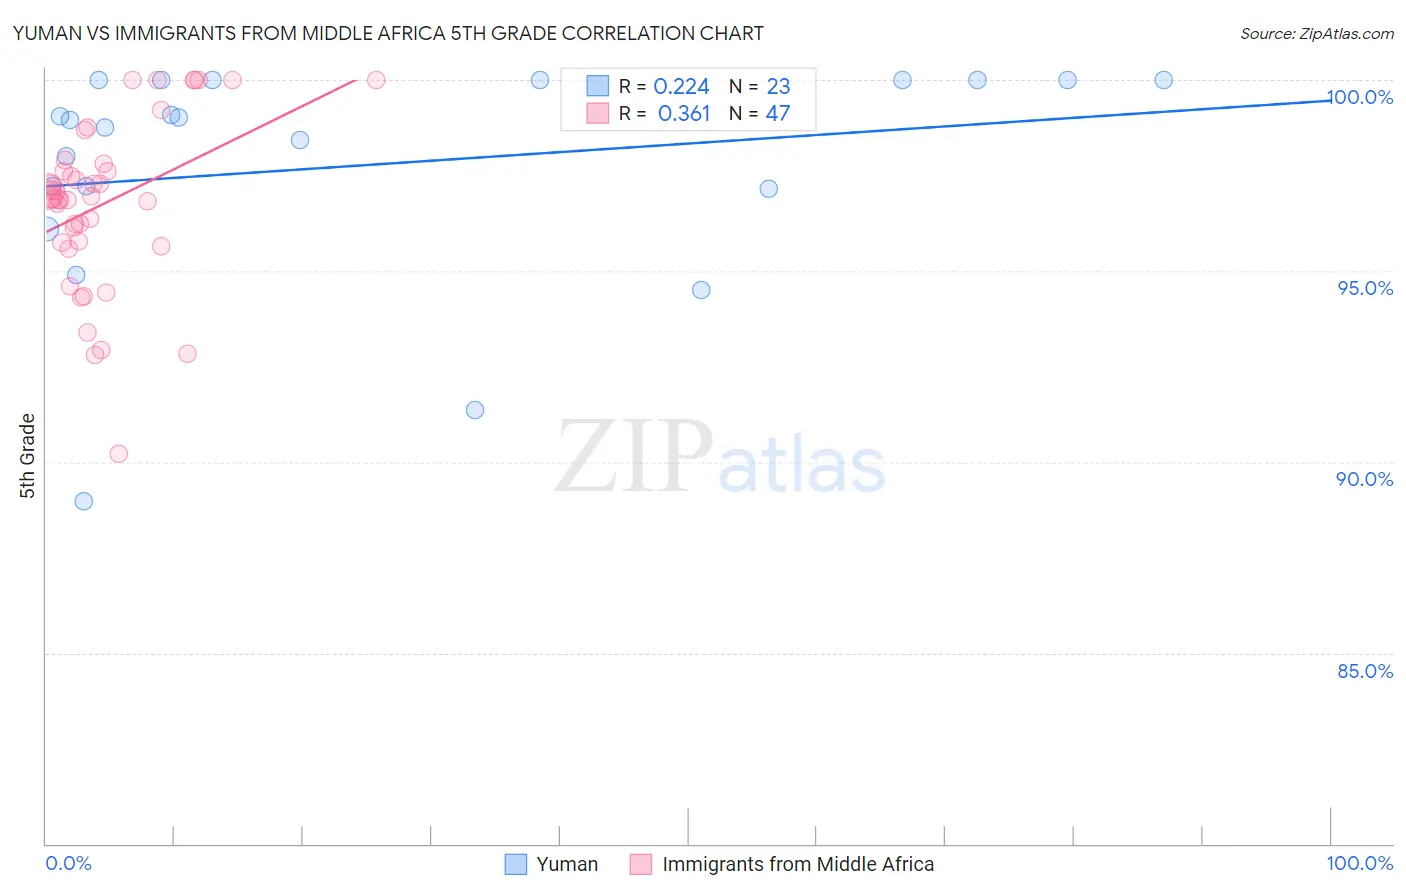
Yuman vs Immigrants from Middle Africa 5th Grade Correlation Chart
The statistical analysis conducted on geographies consisting of 40,696,349 people shows a weak positive correlation between the proportion of Yuman and percentage of population with at least 5th grade education in the United States with a correlation coefficient (R) of 0.224 and weighted average of 97.0%. Similarly, the statistical analysis conducted on geographies consisting of 202,721,852 people shows a mild positive correlation between the proportion of Immigrants from Middle Africa and percentage of population with at least 5th grade education in the United States with a correlation coefficient (R) of 0.361 and weighted average of 96.8%, a difference of 0.18%.
5th Grade Correlation Summary
| Measurement | Yuman | Immigrants from Middle Africa |
| Minimum | 89.0% | 90.2% |
| Maximum | 100.0% | 100.0% |
| Range | 11.0% | 9.8% |
| Mean | 97.8% | 96.8% |
| Median | 99.0% | 96.9% |
| Interquartile 25% (IQ1) | 97.2% | 95.8% |
| Interquartile 75% (IQ3) | 100.0% | 97.8% |
| Interquartile Range (IQR) | 2.8% | 2.0% |
| Standard Deviation (Sample) | 2.9% | 2.2% |
| Standard Deviation (Population) | 2.9% | 2.2% |
Similar Demographics by 5th Grade
Demographics Similar to Yuman by 5th Grade
In terms of 5th grade, the demographic groups most similar to Yuman are Assyrian/Chaldean/Syriac (97.0%, a difference of 0.0%), Immigrants from Western Asia (97.0%, a difference of 0.0%), Immigrants from Pakistan (97.0%, a difference of 0.010%), Immigrants from Malaysia (97.0%, a difference of 0.010%), and Immigrants from Eastern Asia (97.0%, a difference of 0.010%).
| Demographics | Rating | Rank | 5th Grade |
| Immigrants | Panama | 5.7 /100 | #222 | Tragic 97.0% |
| Liberians | 5.7 /100 | #223 | Tragic 97.0% |
| South American Indians | 5.4 /100 | #224 | Tragic 97.0% |
| Bahamians | 5.3 /100 | #225 | Tragic 97.0% |
| Tongans | 5.3 /100 | #226 | Tragic 97.0% |
| Immigrants | Pakistan | 4.7 /100 | #227 | Tragic 97.0% |
| Assyrians/Chaldeans/Syriacs | 4.5 /100 | #228 | Tragic 97.0% |
| Yuman | 4.5 /100 | #229 | Tragic 97.0% |
| Immigrants | Western Asia | 4.3 /100 | #230 | Tragic 97.0% |
| Immigrants | Malaysia | 4.1 /100 | #231 | Tragic 97.0% |
| Immigrants | Eastern Asia | 4.0 /100 | #232 | Tragic 97.0% |
| Sub-Saharan Africans | 3.3 /100 | #233 | Tragic 97.0% |
| Tohono O'odham | 3.2 /100 | #234 | Tragic 97.0% |
| Uruguayans | 3.2 /100 | #235 | Tragic 97.0% |
| Senegalese | 2.8 /100 | #236 | Tragic 97.0% |
Demographics Similar to Immigrants from Middle Africa by 5th Grade
In terms of 5th grade, the demographic groups most similar to Immigrants from Middle Africa are Bolivian (96.9%, a difference of 0.010%), Jamaican (96.9%, a difference of 0.010%), Immigrants from Senegal (96.8%, a difference of 0.010%), Immigrants from Uruguay (96.9%, a difference of 0.020%), and Immigrants from Liberia (96.9%, a difference of 0.020%).
| Demographics | Rating | Rank | 5th Grade |
| Ethiopians | 1.2 /100 | #246 | Tragic 96.9% |
| Immigrants | Africa | 1.1 /100 | #247 | Tragic 96.9% |
| U.S. Virgin Islanders | 1.1 /100 | #248 | Tragic 96.9% |
| Immigrants | Uruguay | 1.0 /100 | #249 | Tragic 96.9% |
| Immigrants | Liberia | 1.0 /100 | #250 | Tragic 96.9% |
| Bolivians | 0.9 /100 | #251 | Tragic 96.9% |
| Jamaicans | 0.9 /100 | #252 | Tragic 96.9% |
| Immigrants | Middle Africa | 0.8 /100 | #253 | Tragic 96.8% |
| Immigrants | Senegal | 0.8 /100 | #254 | Tragic 96.8% |
| South Americans | 0.7 /100 | #255 | Tragic 96.8% |
| Immigrants | Congo | 0.7 /100 | #256 | Tragic 96.8% |
| Peruvians | 0.6 /100 | #257 | Tragic 96.8% |
| Immigrants | Ethiopia | 0.5 /100 | #258 | Tragic 96.8% |
| Immigrants | China | 0.5 /100 | #259 | Tragic 96.8% |
| Immigrants | Jamaica | 0.4 /100 | #260 | Tragic 96.8% |