Yuman vs Immigrants from Laos 5th Grade
COMPARE
Yuman
Immigrants from Laos
5th Grade
5th Grade Comparison
Yuman
Immigrants from Laos
97.0%
5TH GRADE
4.5/ 100
METRIC RATING
229th/ 347
METRIC RANK
96.0%
5TH GRADE
0.0/ 100
METRIC RATING
305th/ 347
METRIC RANK
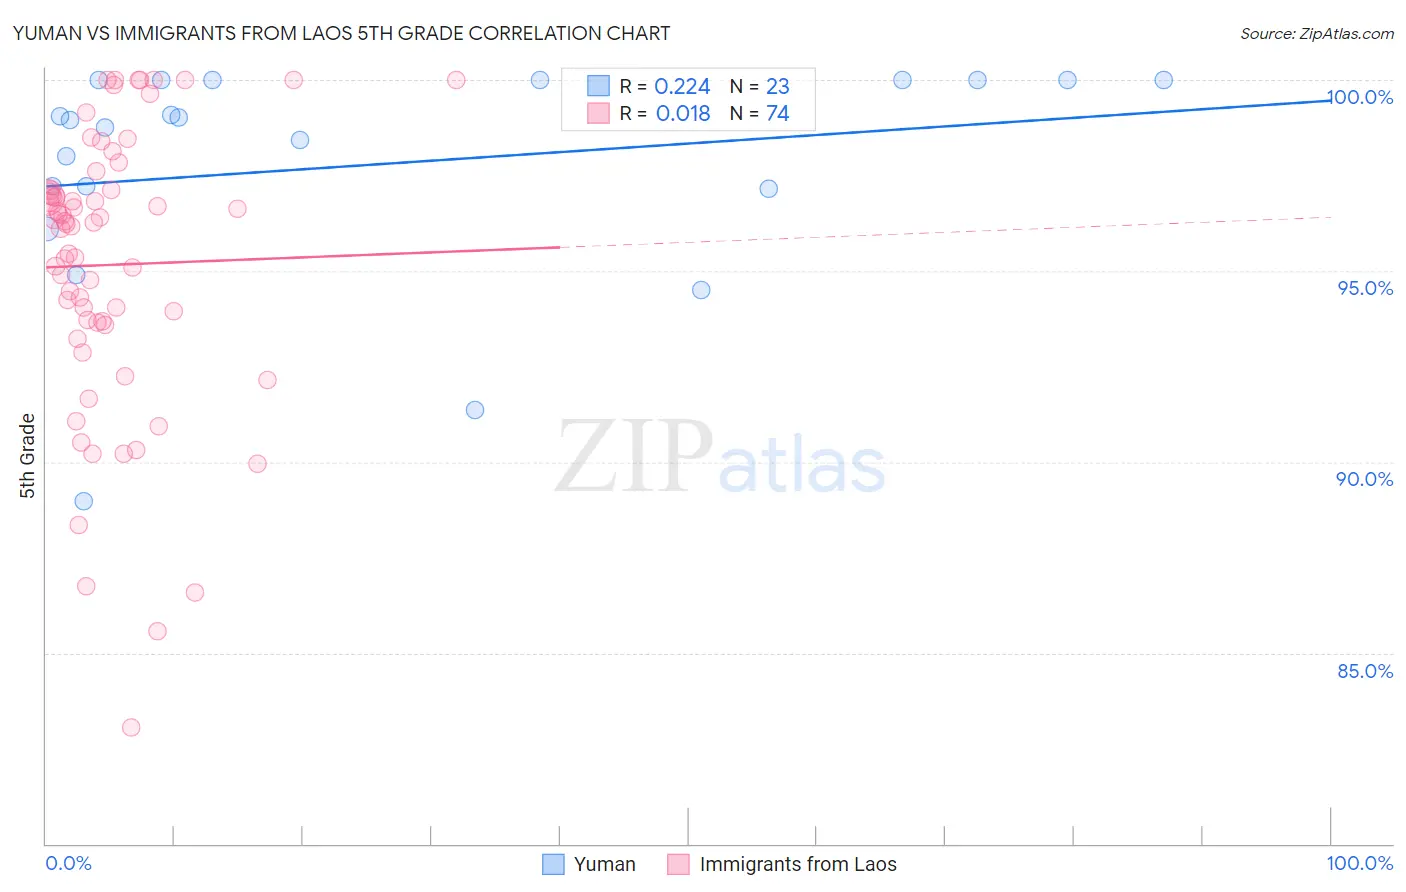
Yuman vs Immigrants from Laos 5th Grade Correlation Chart
The statistical analysis conducted on geographies consisting of 40,696,349 people shows a weak positive correlation between the proportion of Yuman and percentage of population with at least 5th grade education in the United States with a correlation coefficient (R) of 0.224 and weighted average of 97.0%. Similarly, the statistical analysis conducted on geographies consisting of 201,472,886 people shows no correlation between the proportion of Immigrants from Laos and percentage of population with at least 5th grade education in the United States with a correlation coefficient (R) of 0.018 and weighted average of 96.0%, a difference of 1.0%.
5th Grade Correlation Summary
| Measurement | Yuman | Immigrants from Laos |
| Minimum | 89.0% | 83.0% |
| Maximum | 100.0% | 100.0% |
| Range | 11.0% | 17.0% |
| Mean | 97.8% | 95.2% |
| Median | 99.0% | 96.3% |
| Interquartile 25% (IQ1) | 97.2% | 93.7% |
| Interquartile 75% (IQ3) | 100.0% | 97.1% |
| Interquartile Range (IQR) | 2.8% | 3.4% |
| Standard Deviation (Sample) | 2.9% | 3.7% |
| Standard Deviation (Population) | 2.9% | 3.7% |
Similar Demographics by 5th Grade
Demographics Similar to Yuman by 5th Grade
In terms of 5th grade, the demographic groups most similar to Yuman are Assyrian/Chaldean/Syriac (97.0%, a difference of 0.0%), Immigrants from Western Asia (97.0%, a difference of 0.0%), Immigrants from Pakistan (97.0%, a difference of 0.010%), Immigrants from Malaysia (97.0%, a difference of 0.010%), and Immigrants from Eastern Asia (97.0%, a difference of 0.010%).
| Demographics | Rating | Rank | 5th Grade |
| Immigrants | Panama | 5.7 /100 | #222 | Tragic 97.0% |
| Liberians | 5.7 /100 | #223 | Tragic 97.0% |
| South American Indians | 5.4 /100 | #224 | Tragic 97.0% |
| Bahamians | 5.3 /100 | #225 | Tragic 97.0% |
| Tongans | 5.3 /100 | #226 | Tragic 97.0% |
| Immigrants | Pakistan | 4.7 /100 | #227 | Tragic 97.0% |
| Assyrians/Chaldeans/Syriacs | 4.5 /100 | #228 | Tragic 97.0% |
| Yuman | 4.5 /100 | #229 | Tragic 97.0% |
| Immigrants | Western Asia | 4.3 /100 | #230 | Tragic 97.0% |
| Immigrants | Malaysia | 4.1 /100 | #231 | Tragic 97.0% |
| Immigrants | Eastern Asia | 4.0 /100 | #232 | Tragic 97.0% |
| Sub-Saharan Africans | 3.3 /100 | #233 | Tragic 97.0% |
| Tohono O'odham | 3.2 /100 | #234 | Tragic 97.0% |
| Uruguayans | 3.2 /100 | #235 | Tragic 97.0% |
| Senegalese | 2.8 /100 | #236 | Tragic 97.0% |
Demographics Similar to Immigrants from Laos by 5th Grade
In terms of 5th grade, the demographic groups most similar to Immigrants from Laos are Immigrants from Burma/Myanmar (96.1%, a difference of 0.010%), Immigrants from Haiti (96.0%, a difference of 0.010%), Immigrants from Caribbean (96.0%, a difference of 0.020%), Ecuadorian (96.0%, a difference of 0.030%), and Immigrants from Guyana (96.0%, a difference of 0.030%).
| Demographics | Rating | Rank | 5th Grade |
| Immigrants | Dominica | 0.0 /100 | #298 | Tragic 96.2% |
| Immigrants | Immigrants | 0.0 /100 | #299 | Tragic 96.2% |
| Sri Lankans | 0.0 /100 | #300 | Tragic 96.1% |
| Immigrants | Cuba | 0.0 /100 | #301 | Tragic 96.1% |
| Guyanese | 0.0 /100 | #302 | Tragic 96.1% |
| Puerto Ricans | 0.0 /100 | #303 | Tragic 96.1% |
| Immigrants | Burma/Myanmar | 0.0 /100 | #304 | Tragic 96.1% |
| Immigrants | Laos | 0.0 /100 | #305 | Tragic 96.0% |
| Immigrants | Haiti | 0.0 /100 | #306 | Tragic 96.0% |
| Immigrants | Caribbean | 0.0 /100 | #307 | Tragic 96.0% |
| Ecuadorians | 0.0 /100 | #308 | Tragic 96.0% |
| Immigrants | Guyana | 0.0 /100 | #309 | Tragic 96.0% |
| Indonesians | 0.0 /100 | #310 | Tragic 96.0% |
| Immigrants | Bangladesh | 0.0 /100 | #311 | Tragic 96.0% |
| Vietnamese | 0.0 /100 | #312 | Tragic 95.9% |