German Russian vs Immigrants from Middle Africa 5th Grade
COMPARE
German Russian
Immigrants from Middle Africa
5th Grade
5th Grade Comparison
German Russians
Immigrants from Middle Africa
97.7%
5TH GRADE
97.8/ 100
METRIC RATING
104th/ 347
METRIC RANK
96.8%
5TH GRADE
0.8/ 100
METRIC RATING
253rd/ 347
METRIC RANK
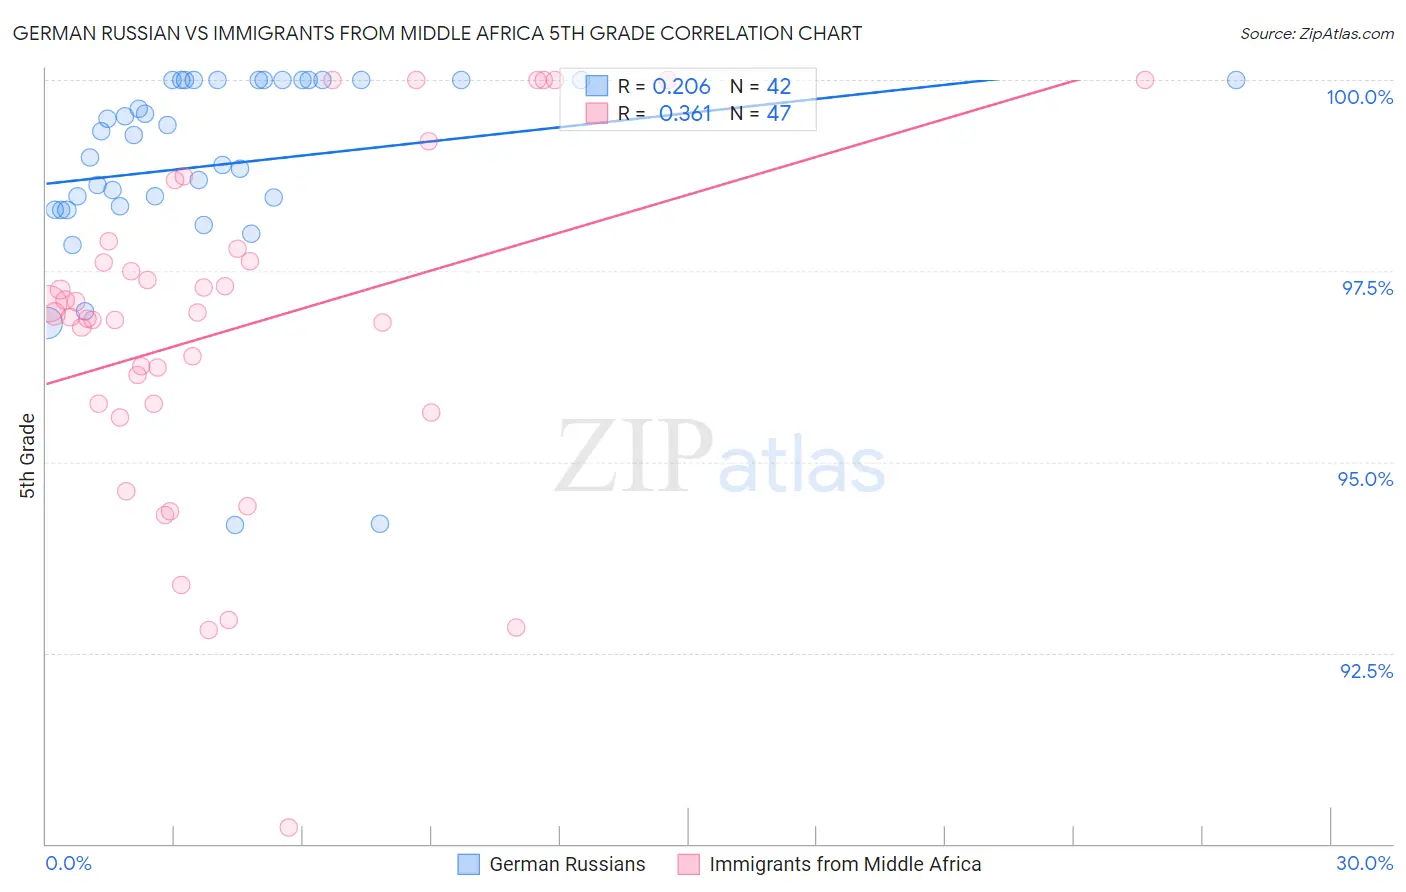
German Russian vs Immigrants from Middle Africa 5th Grade Correlation Chart
The statistical analysis conducted on geographies consisting of 96,461,520 people shows a weak positive correlation between the proportion of German Russians and percentage of population with at least 5th grade education in the United States with a correlation coefficient (R) of 0.206 and weighted average of 97.7%. Similarly, the statistical analysis conducted on geographies consisting of 202,721,852 people shows a mild positive correlation between the proportion of Immigrants from Middle Africa and percentage of population with at least 5th grade education in the United States with a correlation coefficient (R) of 0.361 and weighted average of 96.8%, a difference of 0.89%.
5th Grade Correlation Summary
| Measurement | German Russian | Immigrants from Middle Africa |
| Minimum | 94.2% | 90.2% |
| Maximum | 100.0% | 100.0% |
| Range | 5.8% | 9.8% |
| Mean | 98.9% | 96.8% |
| Median | 99.3% | 96.9% |
| Interquartile 25% (IQ1) | 98.4% | 95.8% |
| Interquartile 75% (IQ3) | 100.0% | 97.8% |
| Interquartile Range (IQR) | 1.6% | 2.0% |
| Standard Deviation (Sample) | 1.4% | 2.2% |
| Standard Deviation (Population) | 1.4% | 2.2% |
Similar Demographics by 5th Grade
Demographics Similar to German Russians by 5th Grade
In terms of 5th grade, the demographic groups most similar to German Russians are Choctaw (97.7%, a difference of 0.010%), Cheyenne (97.7%, a difference of 0.010%), Bhutanese (97.7%, a difference of 0.010%), Immigrants from Czechoslovakia (97.7%, a difference of 0.010%), and Immigrants from Singapore (97.7%, a difference of 0.010%).
| Demographics | Rating | Rank | 5th Grade |
| Cree | 98.4 /100 | #97 | Exceptional 97.7% |
| Yugoslavians | 98.3 /100 | #98 | Exceptional 97.7% |
| Turks | 98.3 /100 | #99 | Exceptional 97.7% |
| Puget Sound Salish | 98.3 /100 | #100 | Exceptional 97.7% |
| South Africans | 98.3 /100 | #101 | Exceptional 97.7% |
| Choctaw | 98.0 /100 | #102 | Exceptional 97.7% |
| Cheyenne | 97.9 /100 | #103 | Exceptional 97.7% |
| German Russians | 97.8 /100 | #104 | Exceptional 97.7% |
| Bhutanese | 97.6 /100 | #105 | Exceptional 97.7% |
| Immigrants | Czechoslovakia | 97.5 /100 | #106 | Exceptional 97.7% |
| Immigrants | Singapore | 97.5 /100 | #107 | Exceptional 97.7% |
| Immigrants | Nonimmigrants | 97.3 /100 | #108 | Exceptional 97.7% |
| Immigrants | Latvia | 97.1 /100 | #109 | Exceptional 97.7% |
| Thais | 96.9 /100 | #110 | Exceptional 97.7% |
| Menominee | 96.3 /100 | #111 | Exceptional 97.7% |
Demographics Similar to Immigrants from Middle Africa by 5th Grade
In terms of 5th grade, the demographic groups most similar to Immigrants from Middle Africa are Bolivian (96.9%, a difference of 0.010%), Jamaican (96.9%, a difference of 0.010%), Immigrants from Senegal (96.8%, a difference of 0.010%), Immigrants from Uruguay (96.9%, a difference of 0.020%), and Immigrants from Liberia (96.9%, a difference of 0.020%).
| Demographics | Rating | Rank | 5th Grade |
| Ethiopians | 1.2 /100 | #246 | Tragic 96.9% |
| Immigrants | Africa | 1.1 /100 | #247 | Tragic 96.9% |
| U.S. Virgin Islanders | 1.1 /100 | #248 | Tragic 96.9% |
| Immigrants | Uruguay | 1.0 /100 | #249 | Tragic 96.9% |
| Immigrants | Liberia | 1.0 /100 | #250 | Tragic 96.9% |
| Bolivians | 0.9 /100 | #251 | Tragic 96.9% |
| Jamaicans | 0.9 /100 | #252 | Tragic 96.9% |
| Immigrants | Middle Africa | 0.8 /100 | #253 | Tragic 96.8% |
| Immigrants | Senegal | 0.8 /100 | #254 | Tragic 96.8% |
| South Americans | 0.7 /100 | #255 | Tragic 96.8% |
| Immigrants | Congo | 0.7 /100 | #256 | Tragic 96.8% |
| Peruvians | 0.6 /100 | #257 | Tragic 96.8% |
| Immigrants | Ethiopia | 0.5 /100 | #258 | Tragic 96.8% |
| Immigrants | China | 0.5 /100 | #259 | Tragic 96.8% |
| Immigrants | Jamaica | 0.4 /100 | #260 | Tragic 96.8% |