Yuman vs Immigrants from Middle Africa Male Unemployment
COMPARE
Yuman
Immigrants from Middle Africa
Male Unemployment
Male Unemployment Comparison
Yuman
Immigrants from Middle Africa
8.6%
MALE UNEMPLOYMENT
0.0/ 100
METRIC RATING
336th/ 347
METRIC RANK
5.5%
MALE UNEMPLOYMENT
8.3/ 100
METRIC RATING
209th/ 347
METRIC RANK
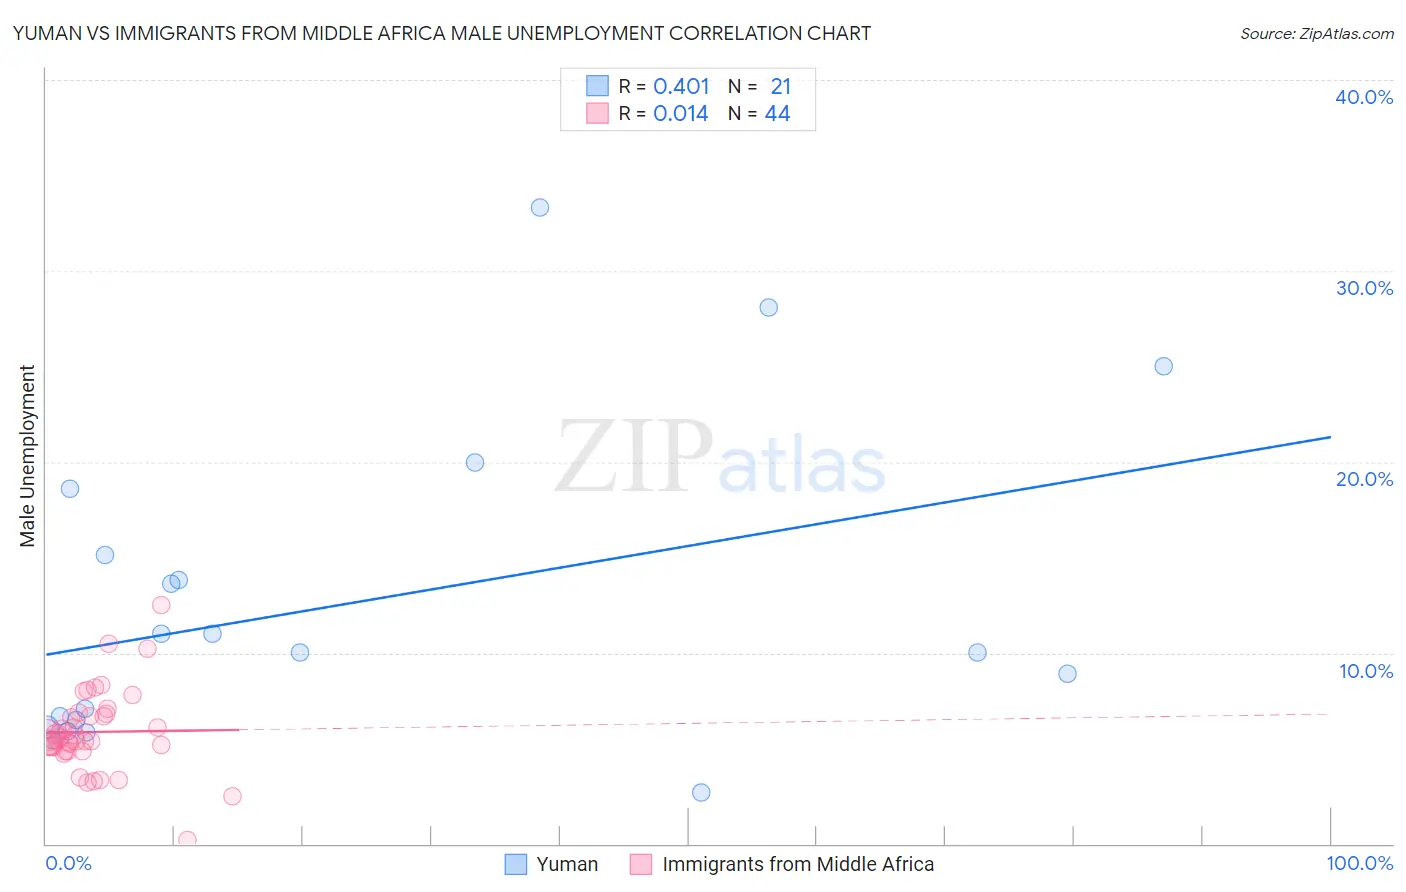
Yuman vs Immigrants from Middle Africa Male Unemployment Correlation Chart
The statistical analysis conducted on geographies consisting of 40,618,581 people shows a moderate positive correlation between the proportion of Yuman and unemployment rate among males in the United States with a correlation coefficient (R) of 0.401 and weighted average of 8.6%. Similarly, the statistical analysis conducted on geographies consisting of 202,406,259 people shows no correlation between the proportion of Immigrants from Middle Africa and unemployment rate among males in the United States with a correlation coefficient (R) of 0.014 and weighted average of 5.5%, a difference of 56.6%.
Male Unemployment Correlation Summary
| Measurement | Yuman | Immigrants from Middle Africa |
| Minimum | 2.7% | 0.20% |
| Maximum | 33.3% | 12.5% |
| Range | 30.6% | 12.3% |
| Mean | 12.6% | 5.9% |
| Median | 10.0% | 5.5% |
| Interquartile 25% (IQ1) | 6.3% | 5.0% |
| Interquartile 75% (IQ3) | 16.9% | 6.8% |
| Interquartile Range (IQR) | 10.6% | 1.8% |
| Standard Deviation (Sample) | 8.2% | 2.1% |
| Standard Deviation (Population) | 8.0% | 2.1% |
Similar Demographics by Male Unemployment
Demographics Similar to Yuman by Male Unemployment
In terms of male unemployment, the demographic groups most similar to Yuman are Puerto Rican (8.6%, a difference of 0.080%), Apache (8.6%, a difference of 0.23%), Pueblo (8.5%, a difference of 1.4%), Tsimshian (8.5%, a difference of 1.4%), and Sioux (8.4%, a difference of 2.4%).
| Demographics | Rating | Rank | Male Unemployment |
| Immigrants | Yemen | 0.0 /100 | #329 | Tragic 7.8% |
| Yakama | 0.0 /100 | #330 | Tragic 7.9% |
| Alaska Natives | 0.0 /100 | #331 | Tragic 8.1% |
| Pima | 0.0 /100 | #332 | Tragic 8.3% |
| Sioux | 0.0 /100 | #333 | Tragic 8.4% |
| Tsimshian | 0.0 /100 | #334 | Tragic 8.5% |
| Pueblo | 0.0 /100 | #335 | Tragic 8.5% |
| Yuman | 0.0 /100 | #336 | Tragic 8.6% |
| Puerto Ricans | 0.0 /100 | #337 | Tragic 8.6% |
| Apache | 0.0 /100 | #338 | Tragic 8.6% |
| Cheyenne | 0.0 /100 | #339 | Tragic 9.8% |
| Alaskan Athabascans | 0.0 /100 | #340 | Tragic 9.8% |
| Navajo | 0.0 /100 | #341 | Tragic 9.8% |
| Tohono O'odham | 0.0 /100 | #342 | Tragic 10.2% |
| Crow | 0.0 /100 | #343 | Tragic 10.6% |
Demographics Similar to Immigrants from Middle Africa by Male Unemployment
In terms of male unemployment, the demographic groups most similar to Immigrants from Middle Africa are Immigrants from Lebanon (5.5%, a difference of 0.050%), South American Indian (5.5%, a difference of 0.13%), Israeli (5.5%, a difference of 0.17%), Immigrants from Syria (5.5%, a difference of 0.18%), and Hmong (5.5%, a difference of 0.27%).
| Demographics | Rating | Rank | Male Unemployment |
| Immigrants | Nonimmigrants | 13.1 /100 | #202 | Poor 5.4% |
| Immigrants | Laos | 13.0 /100 | #203 | Poor 5.4% |
| Guamanians/Chamorros | 12.3 /100 | #204 | Poor 5.4% |
| Immigrants | Costa Rica | 11.4 /100 | #205 | Poor 5.5% |
| Immigrants | Ukraine | 9.9 /100 | #206 | Tragic 5.5% |
| Immigrants | Syria | 9.3 /100 | #207 | Tragic 5.5% |
| Immigrants | Lebanon | 8.6 /100 | #208 | Tragic 5.5% |
| Immigrants | Middle Africa | 8.3 /100 | #209 | Tragic 5.5% |
| South American Indians | 7.6 /100 | #210 | Tragic 5.5% |
| Israelis | 7.4 /100 | #211 | Tragic 5.5% |
| Hmong | 7.0 /100 | #212 | Tragic 5.5% |
| Ugandans | 6.3 /100 | #213 | Tragic 5.5% |
| Puget Sound Salish | 5.6 /100 | #214 | Tragic 5.5% |
| Samoans | 4.9 /100 | #215 | Tragic 5.5% |
| Immigrants | Immigrants | 4.3 /100 | #216 | Tragic 5.5% |