Luxembourger vs Immigrants from Argentina 9th Grade
COMPARE
Luxembourger
Immigrants from Argentina
9th Grade
9th Grade Comparison
Luxembourgers
Immigrants from Argentina
96.3%
9TH GRADE
100.0/ 100
METRIC RATING
33rd/ 347
METRIC RANK
94.8%
9TH GRADE
34.4/ 100
METRIC RATING
189th/ 347
METRIC RANK
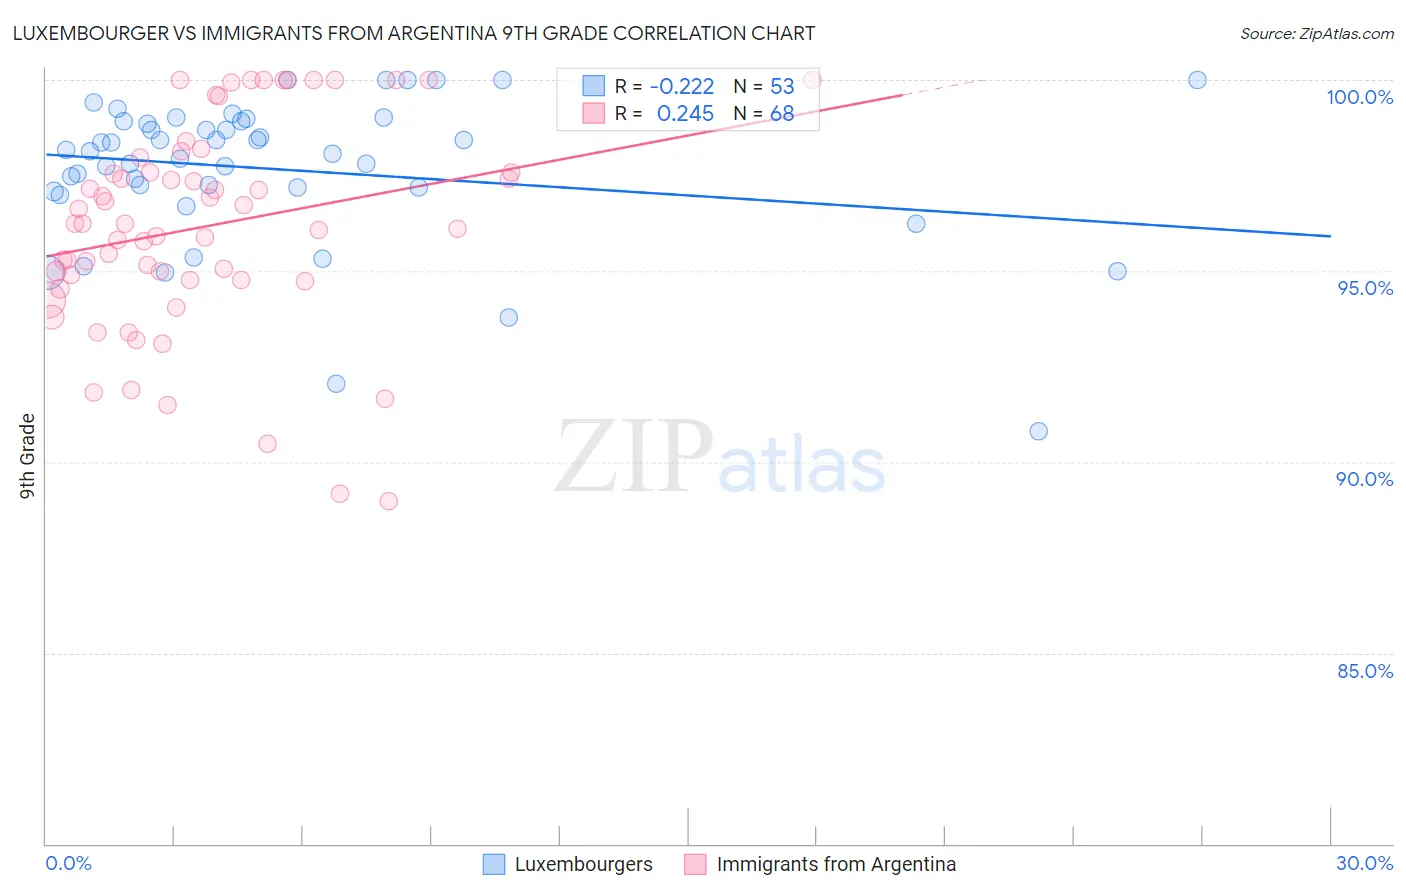
Luxembourger vs Immigrants from Argentina 9th Grade Correlation Chart
The statistical analysis conducted on geographies consisting of 144,676,190 people shows a weak negative correlation between the proportion of Luxembourgers and percentage of population with at least 9th grade education in the United States with a correlation coefficient (R) of -0.222 and weighted average of 96.3%. Similarly, the statistical analysis conducted on geographies consisting of 264,436,618 people shows a weak positive correlation between the proportion of Immigrants from Argentina and percentage of population with at least 9th grade education in the United States with a correlation coefficient (R) of 0.245 and weighted average of 94.8%, a difference of 1.6%.
9th Grade Correlation Summary
| Measurement | Luxembourger | Immigrants from Argentina |
| Minimum | 90.8% | 89.0% |
| Maximum | 100.0% | 100.0% |
| Range | 9.2% | 11.0% |
| Mean | 97.7% | 96.2% |
| Median | 98.1% | 96.2% |
| Interquartile 25% (IQ1) | 97.1% | 94.8% |
| Interquartile 75% (IQ3) | 98.9% | 97.8% |
| Interquartile Range (IQR) | 1.8% | 3.0% |
| Standard Deviation (Sample) | 1.9% | 2.7% |
| Standard Deviation (Population) | 1.9% | 2.7% |
Similar Demographics by 9th Grade
Demographics Similar to Luxembourgers by 9th Grade
In terms of 9th grade, the demographic groups most similar to Luxembourgers are British (96.3%, a difference of 0.010%), Belgian (96.3%, a difference of 0.010%), Maltese (96.3%, a difference of 0.020%), Hungarian (96.2%, a difference of 0.030%), and Chinese (96.3%, a difference of 0.040%).
| Demographics | Rating | Rank | 9th Grade |
| French Canadians | 100.0 /100 | #26 | Exceptional 96.3% |
| Scotch-Irish | 100.0 /100 | #27 | Exceptional 96.3% |
| Eastern Europeans | 100.0 /100 | #28 | Exceptional 96.3% |
| Chinese | 100.0 /100 | #29 | Exceptional 96.3% |
| Maltese | 100.0 /100 | #30 | Exceptional 96.3% |
| British | 100.0 /100 | #31 | Exceptional 96.3% |
| Belgians | 100.0 /100 | #32 | Exceptional 96.3% |
| Luxembourgers | 100.0 /100 | #33 | Exceptional 96.3% |
| Hungarians | 100.0 /100 | #34 | Exceptional 96.2% |
| Bulgarians | 99.9 /100 | #35 | Exceptional 96.2% |
| Northern Europeans | 99.9 /100 | #36 | Exceptional 96.2% |
| Estonians | 99.9 /100 | #37 | Exceptional 96.1% |
| Immigrants | Scotland | 99.9 /100 | #38 | Exceptional 96.1% |
| Ottawa | 99.9 /100 | #39 | Exceptional 96.1% |
| Slavs | 99.9 /100 | #40 | Exceptional 96.1% |
Demographics Similar to Immigrants from Argentina by 9th Grade
In terms of 9th grade, the demographic groups most similar to Immigrants from Argentina are Immigrants from Albania (94.8%, a difference of 0.0%), Guamanian/Chamorro (94.8%, a difference of 0.010%), Sudanese (94.7%, a difference of 0.010%), Liberian (94.8%, a difference of 0.020%), and Hopi (94.8%, a difference of 0.020%).
| Demographics | Rating | Rank | 9th Grade |
| Seminole | 42.5 /100 | #182 | Average 94.8% |
| Immigrants | Nepal | 39.7 /100 | #183 | Fair 94.8% |
| Argentineans | 37.6 /100 | #184 | Fair 94.8% |
| Liberians | 37.4 /100 | #185 | Fair 94.8% |
| Hopi | 37.1 /100 | #186 | Fair 94.8% |
| Guamanians/Chamorros | 35.5 /100 | #187 | Fair 94.8% |
| Immigrants | Albania | 34.5 /100 | #188 | Fair 94.8% |
| Immigrants | Argentina | 34.4 /100 | #189 | Fair 94.8% |
| Sudanese | 32.7 /100 | #190 | Fair 94.7% |
| Assyrians/Chaldeans/Syriacs | 32.0 /100 | #191 | Fair 94.7% |
| Immigrants | Northern Africa | 30.7 /100 | #192 | Fair 94.7% |
| Paraguayans | 30.1 /100 | #193 | Fair 94.7% |
| Panamanians | 29.0 /100 | #194 | Fair 94.7% |
| Marshallese | 27.9 /100 | #195 | Fair 94.7% |
| Immigrants | Lebanon | 27.2 /100 | #196 | Fair 94.7% |