Czech vs Immigrants from Sweden High School Diploma
COMPARE
Czech
Immigrants from Sweden
High School Diploma
High School Diploma Comparison
Czechs
Immigrants from Sweden
91.6%
HIGH SCHOOL DIPLOMA
99.9/ 100
METRIC RATING
20th/ 347
METRIC RANK
91.1%
HIGH SCHOOL DIPLOMA
99.7/ 100
METRIC RATING
52nd/ 347
METRIC RANK
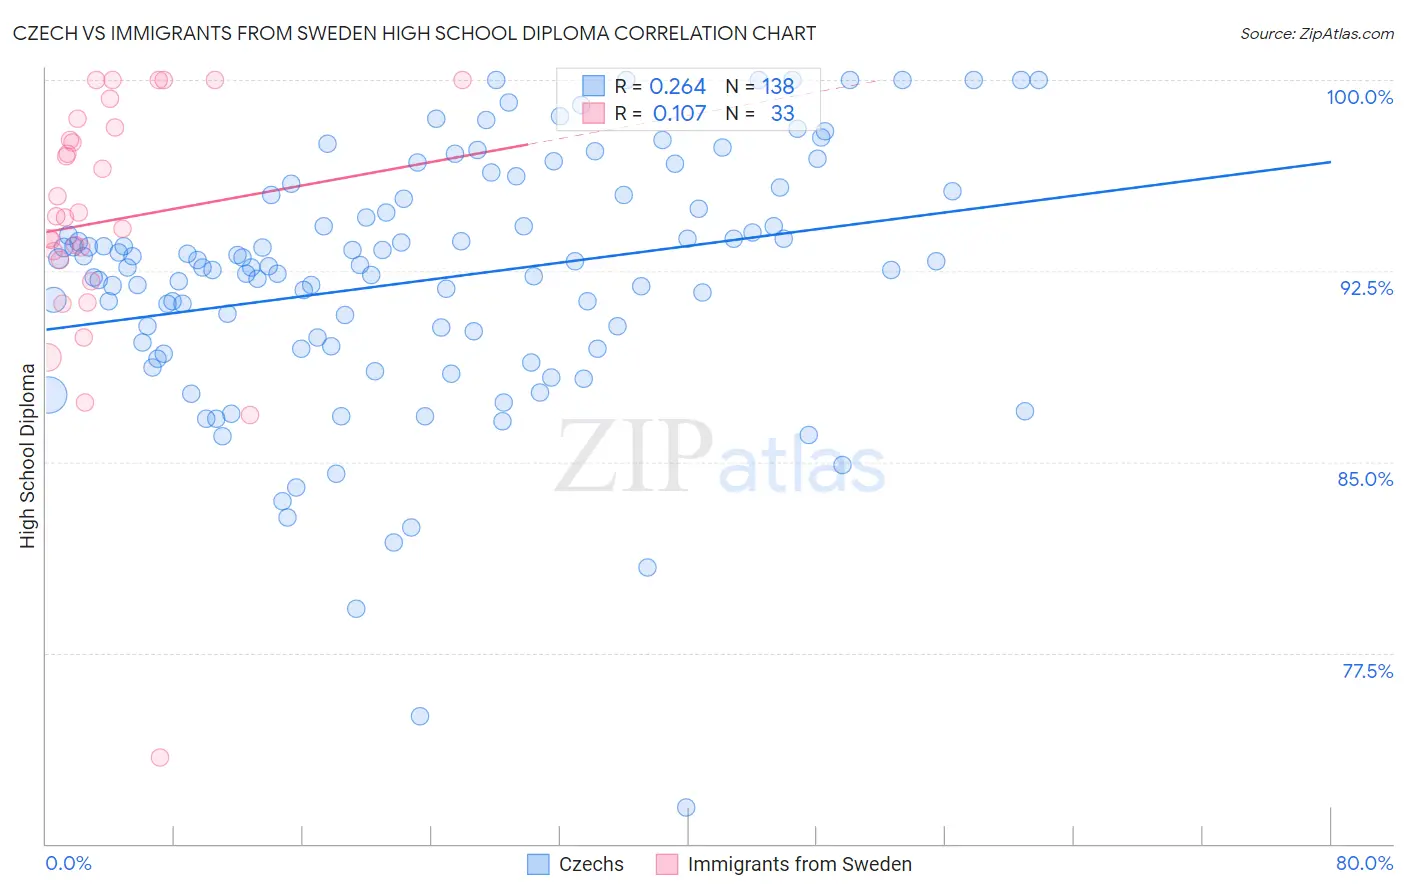
Czech vs Immigrants from Sweden High School Diploma Correlation Chart
The statistical analysis conducted on geographies consisting of 484,813,791 people shows a weak positive correlation between the proportion of Czechs and percentage of population with at least high school diploma education in the United States with a correlation coefficient (R) of 0.264 and weighted average of 91.6%. Similarly, the statistical analysis conducted on geographies consisting of 164,737,092 people shows a poor positive correlation between the proportion of Immigrants from Sweden and percentage of population with at least high school diploma education in the United States with a correlation coefficient (R) of 0.107 and weighted average of 91.1%, a difference of 0.49%.
High School Diploma Correlation Summary
| Measurement | Czech | Immigrants from Sweden |
| Minimum | 71.4% | 73.4% |
| Maximum | 100.0% | 100.0% |
| Range | 28.6% | 26.6% |
| Mean | 92.2% | 94.5% |
| Median | 92.7% | 94.6% |
| Interquartile 25% (IQ1) | 89.5% | 92.5% |
| Interquartile 75% (IQ3) | 95.3% | 98.3% |
| Interquartile Range (IQR) | 5.8% | 5.8% |
| Standard Deviation (Sample) | 5.0% | 5.3% |
| Standard Deviation (Population) | 4.9% | 5.3% |
Similar Demographics by High School Diploma
Demographics Similar to Czechs by High School Diploma
In terms of high school diploma, the demographic groups most similar to Czechs are Filipino (91.6%, a difference of 0.010%), Estonian (91.6%, a difference of 0.020%), Maltese (91.6%, a difference of 0.030%), Scandinavian (91.5%, a difference of 0.050%), and Italian (91.5%, a difference of 0.050%).
| Demographics | Rating | Rank | High School Diploma |
| Danes | 100.0 /100 | #13 | Exceptional 91.8% |
| Bulgarians | 100.0 /100 | #14 | Exceptional 91.8% |
| Luxembourgers | 100.0 /100 | #15 | Exceptional 91.7% |
| Finns | 100.0 /100 | #16 | Exceptional 91.7% |
| Immigrants | Singapore | 99.9 /100 | #17 | Exceptional 91.7% |
| Germans | 99.9 /100 | #18 | Exceptional 91.7% |
| Maltese | 99.9 /100 | #19 | Exceptional 91.6% |
| Czechs | 99.9 /100 | #20 | Exceptional 91.6% |
| Filipinos | 99.9 /100 | #21 | Exceptional 91.6% |
| Estonians | 99.9 /100 | #22 | Exceptional 91.6% |
| Scandinavians | 99.9 /100 | #23 | Exceptional 91.5% |
| Italians | 99.9 /100 | #24 | Exceptional 91.5% |
| Thais | 99.9 /100 | #25 | Exceptional 91.5% |
| Russians | 99.9 /100 | #26 | Exceptional 91.5% |
| Cypriots | 99.9 /100 | #27 | Exceptional 91.5% |
Demographics Similar to Immigrants from Sweden by High School Diploma
In terms of high school diploma, the demographic groups most similar to Immigrants from Sweden are New Zealander (91.1%, a difference of 0.0%), Immigrants from Belgium (91.1%, a difference of 0.0%), Macedonian (91.1%, a difference of 0.020%), Serbian (91.1%, a difference of 0.030%), and Welsh (91.2%, a difference of 0.050%).
| Demographics | Rating | Rank | High School Diploma |
| Turks | 99.8 /100 | #45 | Exceptional 91.2% |
| Greeks | 99.8 /100 | #46 | Exceptional 91.2% |
| Australians | 99.8 /100 | #47 | Exceptional 91.2% |
| Belgians | 99.8 /100 | #48 | Exceptional 91.2% |
| Bhutanese | 99.8 /100 | #49 | Exceptional 91.2% |
| Welsh | 99.8 /100 | #50 | Exceptional 91.2% |
| New Zealanders | 99.7 /100 | #51 | Exceptional 91.1% |
| Immigrants | Sweden | 99.7 /100 | #52 | Exceptional 91.1% |
| Immigrants | Belgium | 99.7 /100 | #53 | Exceptional 91.1% |
| Macedonians | 99.7 /100 | #54 | Exceptional 91.1% |
| Serbians | 99.7 /100 | #55 | Exceptional 91.1% |
| Immigrants | Canada | 99.7 /100 | #56 | Exceptional 91.1% |
| Zimbabweans | 99.7 /100 | #57 | Exceptional 91.1% |
| Slavs | 99.7 /100 | #58 | Exceptional 91.0% |
| Immigrants | North America | 99.7 /100 | #59 | Exceptional 91.0% |