Czech vs Immigrants from Sweden Male Unemployment
COMPARE
Czech
Immigrants from Sweden
Male Unemployment
Male Unemployment Comparison
Czechs
Immigrants from Sweden
4.5%
MALE UNEMPLOYMENT
100.0/ 100
METRIC RATING
7th/ 347
METRIC RANK
5.0%
MALE UNEMPLOYMENT
97.4/ 100
METRIC RATING
69th/ 347
METRIC RANK
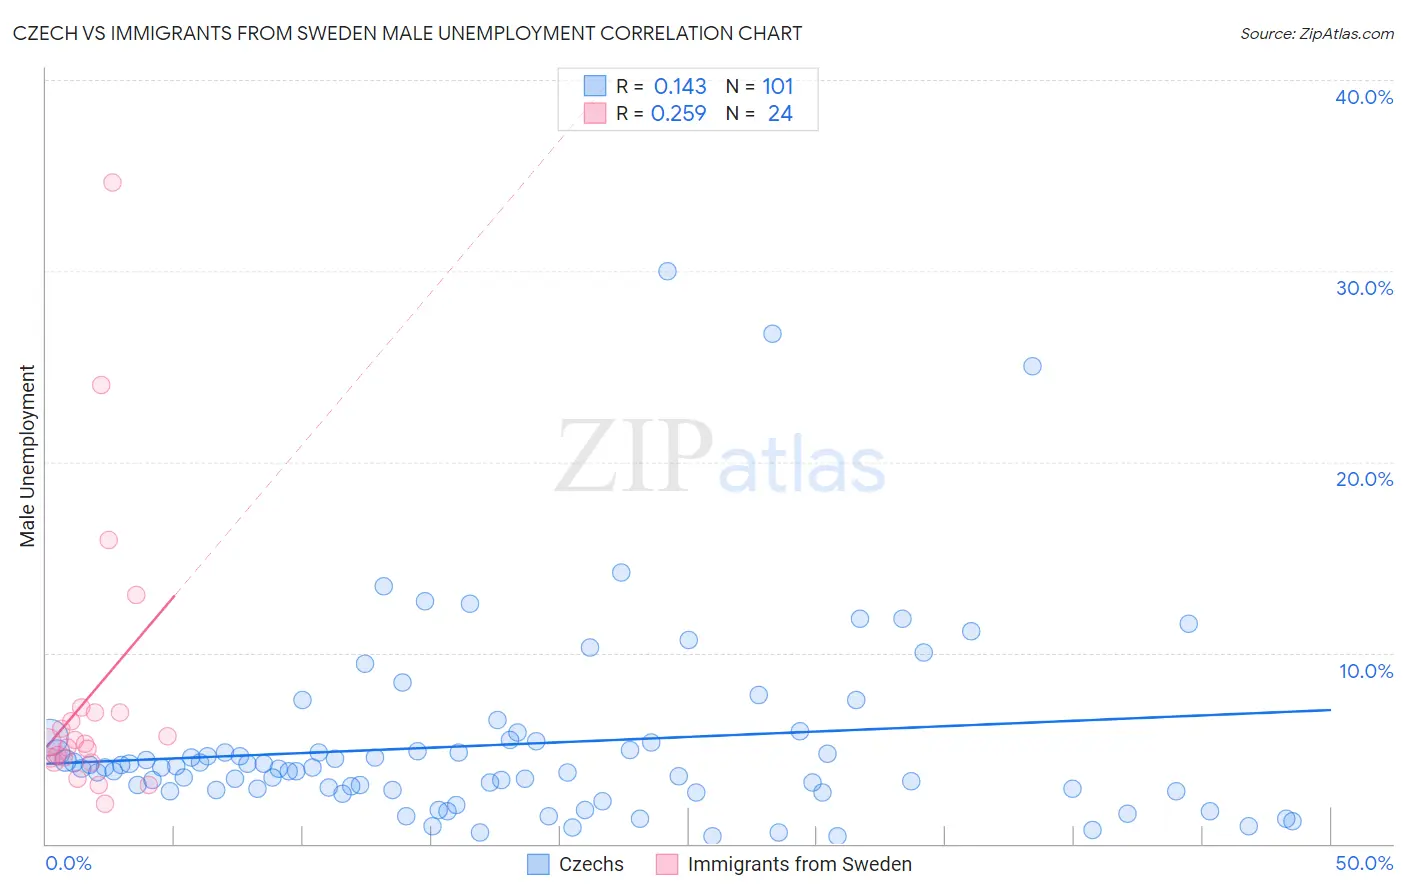
Czech vs Immigrants from Sweden Male Unemployment Correlation Chart
The statistical analysis conducted on geographies consisting of 479,698,612 people shows a poor positive correlation between the proportion of Czechs and unemployment rate among males in the United States with a correlation coefficient (R) of 0.143 and weighted average of 4.5%. Similarly, the statistical analysis conducted on geographies consisting of 164,513,093 people shows a weak positive correlation between the proportion of Immigrants from Sweden and unemployment rate among males in the United States with a correlation coefficient (R) of 0.259 and weighted average of 5.0%, a difference of 10.8%.
Male Unemployment Correlation Summary
| Measurement | Czech | Immigrants from Sweden |
| Minimum | 0.40% | 2.1% |
| Maximum | 30.0% | 34.6% |
| Range | 29.6% | 32.5% |
| Mean | 5.2% | 7.8% |
| Median | 4.0% | 5.3% |
| Interquartile 25% (IQ1) | 2.8% | 4.4% |
| Interquartile 75% (IQ3) | 5.4% | 6.9% |
| Interquartile Range (IQR) | 2.6% | 2.5% |
| Standard Deviation (Sample) | 5.0% | 7.4% |
| Standard Deviation (Population) | 5.0% | 7.3% |
Similar Demographics by Male Unemployment
Demographics Similar to Czechs by Male Unemployment
In terms of male unemployment, the demographic groups most similar to Czechs are Venezuelan (4.5%, a difference of 0.20%), Luxembourger (4.5%, a difference of 0.26%), Danish (4.5%, a difference of 0.65%), Thai (4.6%, a difference of 1.5%), and Immigrants from Venezuela (4.4%, a difference of 1.7%).
| Demographics | Rating | Rank | Male Unemployment |
| Immigrants | India | 100.0 /100 | #1 | Exceptional 4.4% |
| Immigrants | Cuba | 100.0 /100 | #2 | Exceptional 4.4% |
| Norwegians | 100.0 /100 | #3 | Exceptional 4.4% |
| Immigrants | Venezuela | 100.0 /100 | #4 | Exceptional 4.4% |
| Danes | 100.0 /100 | #5 | Exceptional 4.5% |
| Venezuelans | 100.0 /100 | #6 | Exceptional 4.5% |
| Czechs | 100.0 /100 | #7 | Exceptional 4.5% |
| Luxembourgers | 100.0 /100 | #8 | Exceptional 4.5% |
| Thais | 100.0 /100 | #9 | Exceptional 4.6% |
| Cubans | 100.0 /100 | #10 | Exceptional 4.6% |
| Swedes | 100.0 /100 | #11 | Exceptional 4.6% |
| Immigrants | Bolivia | 100.0 /100 | #12 | Exceptional 4.7% |
| Bolivians | 100.0 /100 | #13 | Exceptional 4.7% |
| Germans | 100.0 /100 | #14 | Exceptional 4.7% |
| Scandinavians | 100.0 /100 | #15 | Exceptional 4.7% |
Demographics Similar to Immigrants from Sweden by Male Unemployment
In terms of male unemployment, the demographic groups most similar to Immigrants from Sweden are Australian (5.0%, a difference of 0.030%), Immigrants from Canada (5.0%, a difference of 0.040%), White/Caucasian (5.0%, a difference of 0.050%), Finnish (5.0%, a difference of 0.060%), and New Zealander (5.0%, a difference of 0.070%).
| Demographics | Rating | Rank | Male Unemployment |
| Basques | 97.9 /100 | #62 | Exceptional 5.0% |
| Eastern Europeans | 97.9 /100 | #63 | Exceptional 5.0% |
| Celtics | 97.8 /100 | #64 | Exceptional 5.0% |
| Icelanders | 97.6 /100 | #65 | Exceptional 5.0% |
| Finns | 97.5 /100 | #66 | Exceptional 5.0% |
| Immigrants | Canada | 97.5 /100 | #67 | Exceptional 5.0% |
| Australians | 97.4 /100 | #68 | Exceptional 5.0% |
| Immigrants | Sweden | 97.4 /100 | #69 | Exceptional 5.0% |
| Whites/Caucasians | 97.3 /100 | #70 | Exceptional 5.0% |
| New Zealanders | 97.3 /100 | #71 | Exceptional 5.0% |
| Immigrants | South Africa | 97.1 /100 | #72 | Exceptional 5.0% |
| Greeks | 97.0 /100 | #73 | Exceptional 5.0% |
| Immigrants | North America | 96.9 /100 | #74 | Exceptional 5.0% |
| Assyrians/Chaldeans/Syriacs | 96.9 /100 | #75 | Exceptional 5.0% |
| Immigrants | Sudan | 96.5 /100 | #76 | Exceptional 5.0% |