Immigrants from Northern Europe vs Immigrants from Sweden High School Diploma
COMPARE
Immigrants from Northern Europe
Immigrants from Sweden
High School Diploma
High School Diploma Comparison
Immigrants from Northern Europe
Immigrants from Sweden
91.4%
HIGH SCHOOL DIPLOMA
99.9/ 100
METRIC RATING
31st/ 347
METRIC RANK
91.1%
HIGH SCHOOL DIPLOMA
99.7/ 100
METRIC RATING
52nd/ 347
METRIC RANK
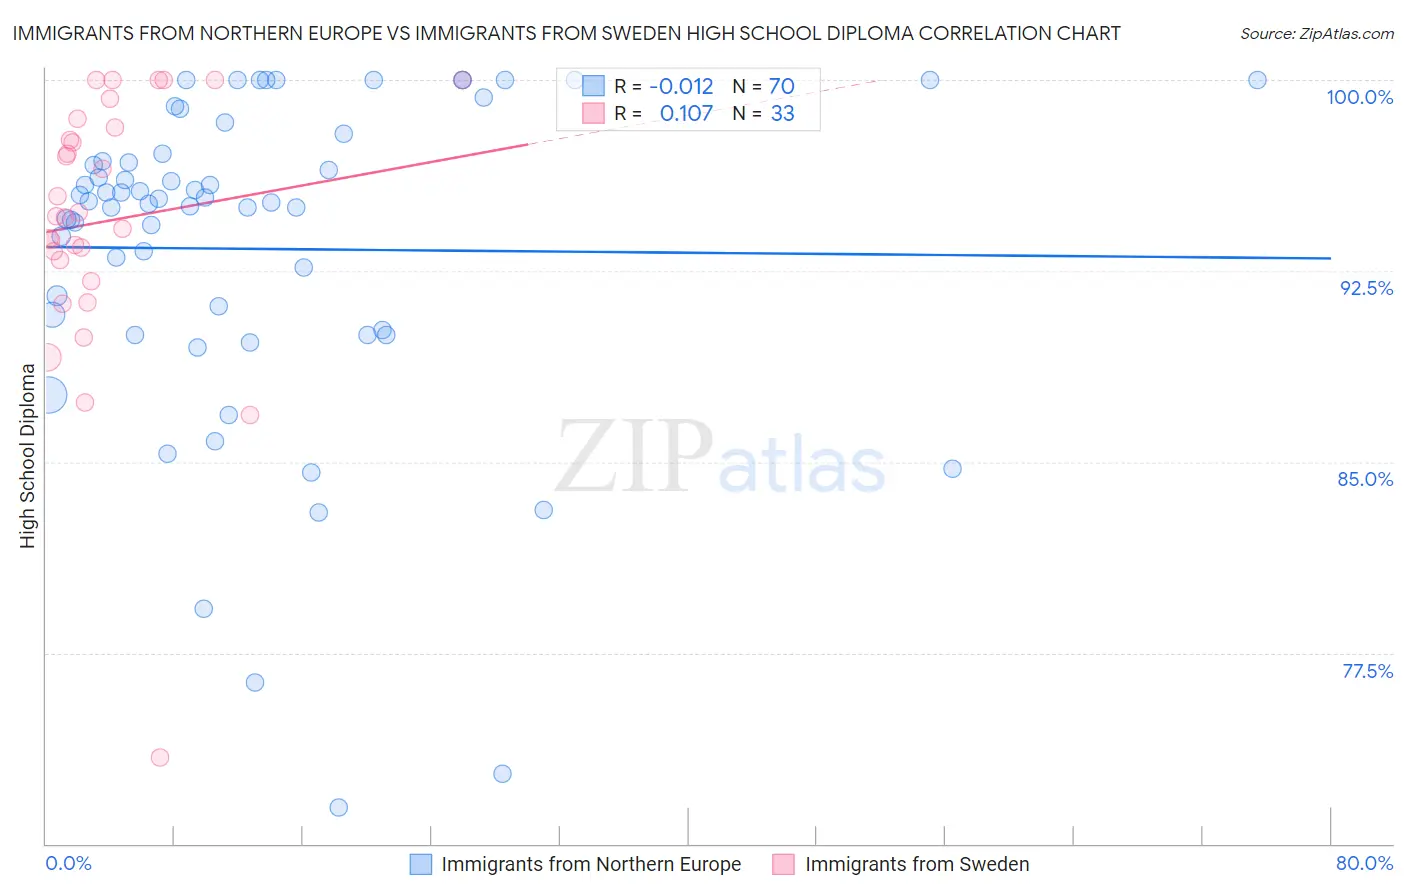
Immigrants from Northern Europe vs Immigrants from Sweden High School Diploma Correlation Chart
The statistical analysis conducted on geographies consisting of 477,226,871 people shows no correlation between the proportion of Immigrants from Northern Europe and percentage of population with at least high school diploma education in the United States with a correlation coefficient (R) of -0.012 and weighted average of 91.4%. Similarly, the statistical analysis conducted on geographies consisting of 164,737,092 people shows a poor positive correlation between the proportion of Immigrants from Sweden and percentage of population with at least high school diploma education in the United States with a correlation coefficient (R) of 0.107 and weighted average of 91.1%, a difference of 0.31%.
High School Diploma Correlation Summary
| Measurement | Immigrants from Northern Europe | Immigrants from Sweden |
| Minimum | 71.4% | 73.4% |
| Maximum | 100.0% | 100.0% |
| Range | 28.6% | 26.6% |
| Mean | 93.4% | 94.5% |
| Median | 95.2% | 94.6% |
| Interquartile 25% (IQ1) | 90.2% | 92.5% |
| Interquartile 75% (IQ3) | 97.1% | 98.3% |
| Interquartile Range (IQR) | 6.9% | 5.8% |
| Standard Deviation (Sample) | 6.4% | 5.3% |
| Standard Deviation (Population) | 6.4% | 5.3% |
Similar Demographics by High School Diploma
Demographics Similar to Immigrants from Northern Europe by High School Diploma
In terms of high school diploma, the demographic groups most similar to Immigrants from Northern Europe are English (91.4%, a difference of 0.0%), European (91.4%, a difference of 0.010%), Iranian (91.4%, a difference of 0.010%), Okinawan (91.4%, a difference of 0.010%), and Scottish (91.4%, a difference of 0.020%).
| Demographics | Rating | Rank | High School Diploma |
| Italians | 99.9 /100 | #24 | Exceptional 91.5% |
| Thais | 99.9 /100 | #25 | Exceptional 91.5% |
| Russians | 99.9 /100 | #26 | Exceptional 91.5% |
| Cypriots | 99.9 /100 | #27 | Exceptional 91.5% |
| Tlingit-Haida | 99.9 /100 | #28 | Exceptional 91.4% |
| Europeans | 99.9 /100 | #29 | Exceptional 91.4% |
| Iranians | 99.9 /100 | #30 | Exceptional 91.4% |
| Immigrants | Northern Europe | 99.9 /100 | #31 | Exceptional 91.4% |
| English | 99.9 /100 | #32 | Exceptional 91.4% |
| Okinawans | 99.9 /100 | #33 | Exceptional 91.4% |
| Scottish | 99.9 /100 | #34 | Exceptional 91.4% |
| Irish | 99.9 /100 | #35 | Exceptional 91.4% |
| Tsimshian | 99.9 /100 | #36 | Exceptional 91.3% |
| Immigrants | Ireland | 99.9 /100 | #37 | Exceptional 91.3% |
| Immigrants | Scotland | 99.8 /100 | #38 | Exceptional 91.3% |
Demographics Similar to Immigrants from Sweden by High School Diploma
In terms of high school diploma, the demographic groups most similar to Immigrants from Sweden are New Zealander (91.1%, a difference of 0.0%), Immigrants from Belgium (91.1%, a difference of 0.0%), Macedonian (91.1%, a difference of 0.020%), Serbian (91.1%, a difference of 0.030%), and Welsh (91.2%, a difference of 0.050%).
| Demographics | Rating | Rank | High School Diploma |
| Turks | 99.8 /100 | #45 | Exceptional 91.2% |
| Greeks | 99.8 /100 | #46 | Exceptional 91.2% |
| Australians | 99.8 /100 | #47 | Exceptional 91.2% |
| Belgians | 99.8 /100 | #48 | Exceptional 91.2% |
| Bhutanese | 99.8 /100 | #49 | Exceptional 91.2% |
| Welsh | 99.8 /100 | #50 | Exceptional 91.2% |
| New Zealanders | 99.7 /100 | #51 | Exceptional 91.1% |
| Immigrants | Sweden | 99.7 /100 | #52 | Exceptional 91.1% |
| Immigrants | Belgium | 99.7 /100 | #53 | Exceptional 91.1% |
| Macedonians | 99.7 /100 | #54 | Exceptional 91.1% |
| Serbians | 99.7 /100 | #55 | Exceptional 91.1% |
| Immigrants | Canada | 99.7 /100 | #56 | Exceptional 91.1% |
| Zimbabweans | 99.7 /100 | #57 | Exceptional 91.1% |
| Slavs | 99.7 /100 | #58 | Exceptional 91.0% |
| Immigrants | North America | 99.7 /100 | #59 | Exceptional 91.0% |