Czech vs Barbadian High School Diploma
COMPARE
Czech
Barbadian
High School Diploma
High School Diploma Comparison
Czechs
Barbadians
91.6%
HIGH SCHOOL DIPLOMA
99.9/ 100
METRIC RATING
20th/ 347
METRIC RANK
86.7%
HIGH SCHOOL DIPLOMA
0.1/ 100
METRIC RATING
277th/ 347
METRIC RANK
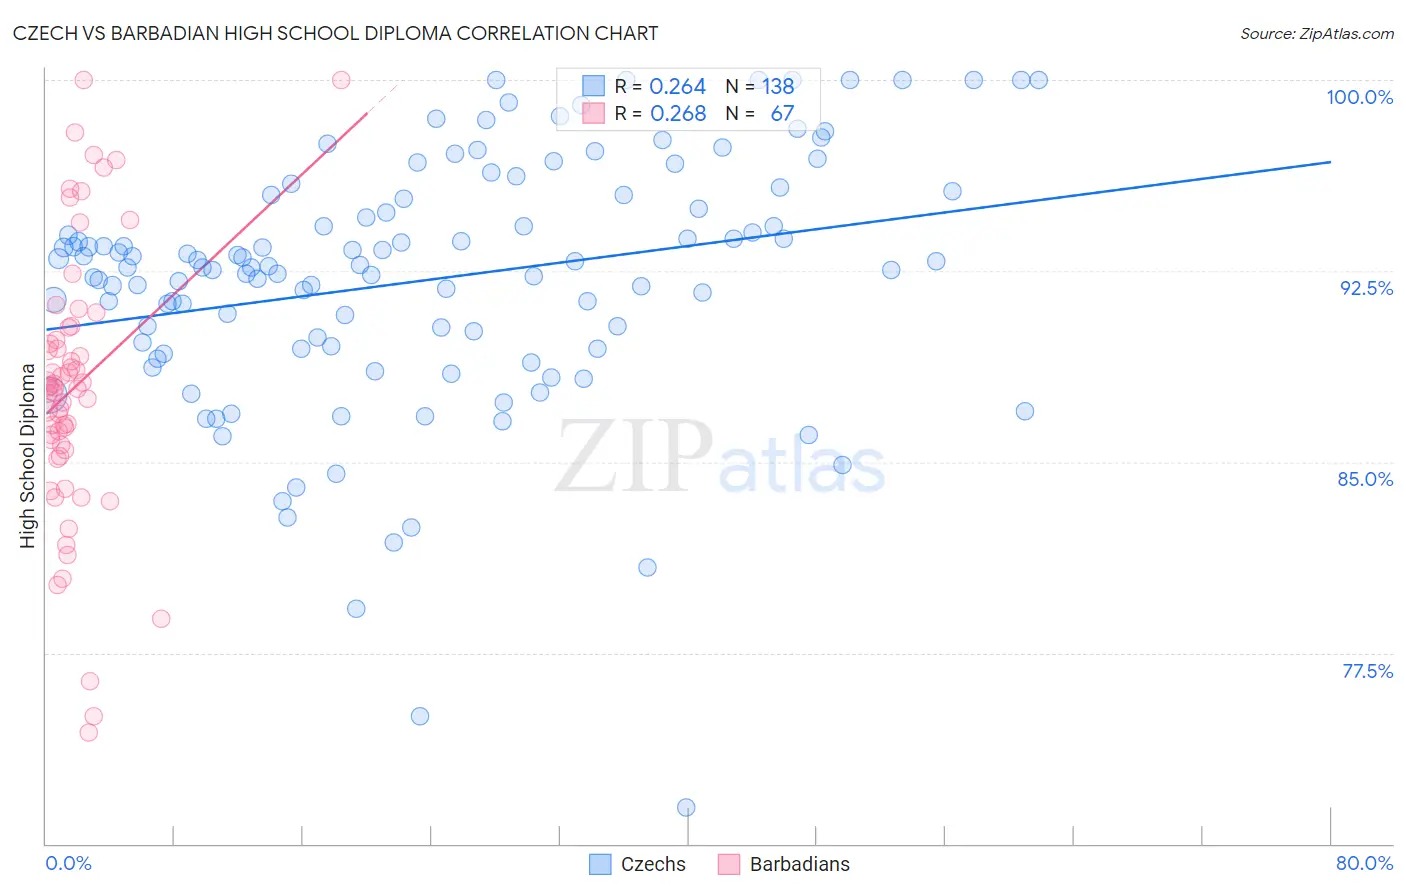
Czech vs Barbadian High School Diploma Correlation Chart
The statistical analysis conducted on geographies consisting of 484,813,791 people shows a weak positive correlation between the proportion of Czechs and percentage of population with at least high school diploma education in the United States with a correlation coefficient (R) of 0.264 and weighted average of 91.6%. Similarly, the statistical analysis conducted on geographies consisting of 141,304,590 people shows a weak positive correlation between the proportion of Barbadians and percentage of population with at least high school diploma education in the United States with a correlation coefficient (R) of 0.268 and weighted average of 86.7%, a difference of 5.6%.
High School Diploma Correlation Summary
| Measurement | Czech | Barbadian |
| Minimum | 71.4% | 74.4% |
| Maximum | 100.0% | 100.0% |
| Range | 28.6% | 25.6% |
| Mean | 92.2% | 87.9% |
| Median | 92.7% | 87.9% |
| Interquartile 25% (IQ1) | 89.5% | 85.4% |
| Interquartile 75% (IQ3) | 95.3% | 90.3% |
| Interquartile Range (IQR) | 5.8% | 4.8% |
| Standard Deviation (Sample) | 5.0% | 5.4% |
| Standard Deviation (Population) | 4.9% | 5.3% |
Similar Demographics by High School Diploma
Demographics Similar to Czechs by High School Diploma
In terms of high school diploma, the demographic groups most similar to Czechs are Filipino (91.6%, a difference of 0.010%), Estonian (91.6%, a difference of 0.020%), Maltese (91.6%, a difference of 0.030%), Scandinavian (91.5%, a difference of 0.050%), and Italian (91.5%, a difference of 0.050%).
| Demographics | Rating | Rank | High School Diploma |
| Danes | 100.0 /100 | #13 | Exceptional 91.8% |
| Bulgarians | 100.0 /100 | #14 | Exceptional 91.8% |
| Luxembourgers | 100.0 /100 | #15 | Exceptional 91.7% |
| Finns | 100.0 /100 | #16 | Exceptional 91.7% |
| Immigrants | Singapore | 99.9 /100 | #17 | Exceptional 91.7% |
| Germans | 99.9 /100 | #18 | Exceptional 91.7% |
| Maltese | 99.9 /100 | #19 | Exceptional 91.6% |
| Czechs | 99.9 /100 | #20 | Exceptional 91.6% |
| Filipinos | 99.9 /100 | #21 | Exceptional 91.6% |
| Estonians | 99.9 /100 | #22 | Exceptional 91.6% |
| Scandinavians | 99.9 /100 | #23 | Exceptional 91.5% |
| Italians | 99.9 /100 | #24 | Exceptional 91.5% |
| Thais | 99.9 /100 | #25 | Exceptional 91.5% |
| Russians | 99.9 /100 | #26 | Exceptional 91.5% |
| Cypriots | 99.9 /100 | #27 | Exceptional 91.5% |
Demographics Similar to Barbadians by High School Diploma
In terms of high school diploma, the demographic groups most similar to Barbadians are Immigrants from Burma/Myanmar (86.7%, a difference of 0.010%), Immigrants from Trinidad and Tobago (86.8%, a difference of 0.080%), Hopi (86.6%, a difference of 0.11%), Immigrants from Laos (86.6%, a difference of 0.15%), and Pueblo (86.5%, a difference of 0.17%).
| Demographics | Rating | Rank | High School Diploma |
| Malaysians | 0.2 /100 | #270 | Tragic 87.0% |
| West Indians | 0.1 /100 | #271 | Tragic 86.9% |
| Trinidadians and Tobagonians | 0.1 /100 | #272 | Tragic 86.9% |
| Immigrants | Jamaica | 0.1 /100 | #273 | Tragic 86.9% |
| Bangladeshis | 0.1 /100 | #274 | Tragic 86.9% |
| Immigrants | Trinidad and Tobago | 0.1 /100 | #275 | Tragic 86.8% |
| Immigrants | Burma/Myanmar | 0.1 /100 | #276 | Tragic 86.7% |
| Barbadians | 0.1 /100 | #277 | Tragic 86.7% |
| Hopi | 0.1 /100 | #278 | Tragic 86.6% |
| Immigrants | Laos | 0.0 /100 | #279 | Tragic 86.6% |
| Pueblo | 0.0 /100 | #280 | Tragic 86.5% |
| Indonesians | 0.0 /100 | #281 | Tragic 86.5% |
| Dutch West Indians | 0.0 /100 | #282 | Tragic 86.5% |
| Immigrants | Barbados | 0.0 /100 | #283 | Tragic 86.4% |
| Paiute | 0.0 /100 | #284 | Tragic 86.4% |