Czech vs Ethiopian High School Diploma
COMPARE
Czech
Ethiopian
High School Diploma
High School Diploma Comparison
Czechs
Ethiopians
91.6%
HIGH SCHOOL DIPLOMA
99.9/ 100
METRIC RATING
20th/ 347
METRIC RANK
89.0%
HIGH SCHOOL DIPLOMA
37.0/ 100
METRIC RATING
185th/ 347
METRIC RANK
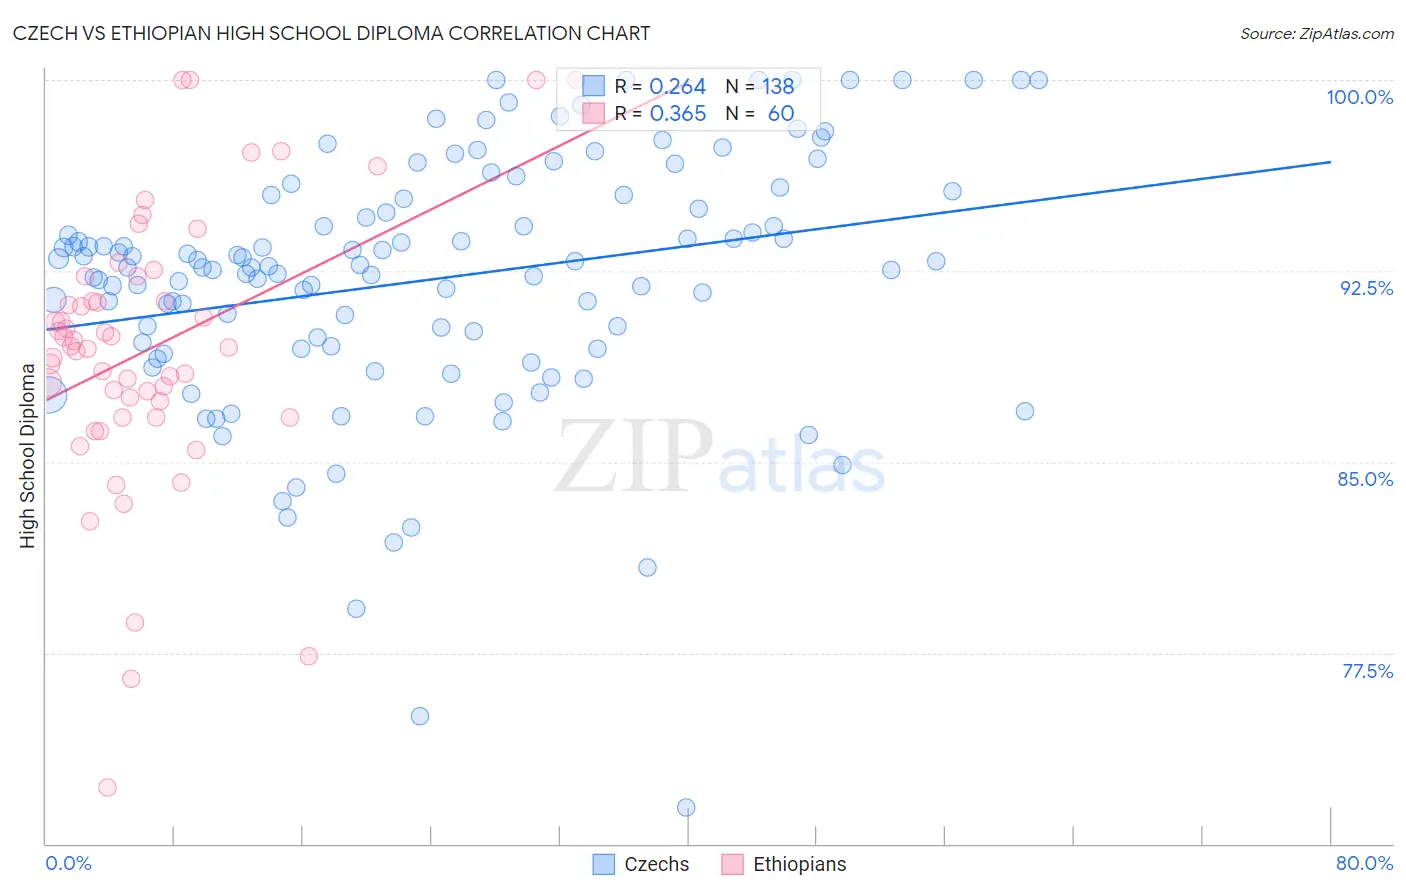
Czech vs Ethiopian High School Diploma Correlation Chart
The statistical analysis conducted on geographies consisting of 484,813,791 people shows a weak positive correlation between the proportion of Czechs and percentage of population with at least high school diploma education in the United States with a correlation coefficient (R) of 0.264 and weighted average of 91.6%. Similarly, the statistical analysis conducted on geographies consisting of 223,235,367 people shows a mild positive correlation between the proportion of Ethiopians and percentage of population with at least high school diploma education in the United States with a correlation coefficient (R) of 0.365 and weighted average of 89.0%, a difference of 2.9%.
High School Diploma Correlation Summary
| Measurement | Czech | Ethiopian |
| Minimum | 71.4% | 72.2% |
| Maximum | 100.0% | 100.0% |
| Range | 28.6% | 27.8% |
| Mean | 92.2% | 89.4% |
| Median | 92.7% | 89.5% |
| Interquartile 25% (IQ1) | 89.5% | 87.1% |
| Interquartile 75% (IQ3) | 95.3% | 91.8% |
| Interquartile Range (IQR) | 5.8% | 4.7% |
| Standard Deviation (Sample) | 5.0% | 5.4% |
| Standard Deviation (Population) | 4.9% | 5.4% |
Similar Demographics by High School Diploma
Demographics Similar to Czechs by High School Diploma
In terms of high school diploma, the demographic groups most similar to Czechs are Filipino (91.6%, a difference of 0.010%), Estonian (91.6%, a difference of 0.020%), Maltese (91.6%, a difference of 0.030%), Scandinavian (91.5%, a difference of 0.050%), and Italian (91.5%, a difference of 0.050%).
| Demographics | Rating | Rank | High School Diploma |
| Danes | 100.0 /100 | #13 | Exceptional 91.8% |
| Bulgarians | 100.0 /100 | #14 | Exceptional 91.8% |
| Luxembourgers | 100.0 /100 | #15 | Exceptional 91.7% |
| Finns | 100.0 /100 | #16 | Exceptional 91.7% |
| Immigrants | Singapore | 99.9 /100 | #17 | Exceptional 91.7% |
| Germans | 99.9 /100 | #18 | Exceptional 91.7% |
| Maltese | 99.9 /100 | #19 | Exceptional 91.6% |
| Czechs | 99.9 /100 | #20 | Exceptional 91.6% |
| Filipinos | 99.9 /100 | #21 | Exceptional 91.6% |
| Estonians | 99.9 /100 | #22 | Exceptional 91.6% |
| Scandinavians | 99.9 /100 | #23 | Exceptional 91.5% |
| Italians | 99.9 /100 | #24 | Exceptional 91.5% |
| Thais | 99.9 /100 | #25 | Exceptional 91.5% |
| Russians | 99.9 /100 | #26 | Exceptional 91.5% |
| Cypriots | 99.9 /100 | #27 | Exceptional 91.5% |
Demographics Similar to Ethiopians by High School Diploma
In terms of high school diploma, the demographic groups most similar to Ethiopians are Immigrants from Eastern Africa (88.9%, a difference of 0.020%), Guamanian/Chamorro (88.9%, a difference of 0.020%), Immigrants from Syria (89.0%, a difference of 0.040%), Immigrants from Sudan (88.9%, a difference of 0.060%), and Immigrants from Uganda (88.9%, a difference of 0.070%).
| Demographics | Rating | Rank | High School Diploma |
| Sierra Leoneans | 48.4 /100 | #178 | Average 89.1% |
| Americans | 47.2 /100 | #179 | Average 89.1% |
| Bolivians | 45.2 /100 | #180 | Average 89.1% |
| Venezuelans | 43.6 /100 | #181 | Average 89.1% |
| Spaniards | 43.4 /100 | #182 | Average 89.1% |
| Potawatomi | 42.5 /100 | #183 | Average 89.0% |
| Immigrants | Syria | 39.2 /100 | #184 | Fair 89.0% |
| Ethiopians | 37.0 /100 | #185 | Fair 89.0% |
| Immigrants | Eastern Africa | 35.8 /100 | #186 | Fair 88.9% |
| Guamanians/Chamorros | 35.5 /100 | #187 | Fair 88.9% |
| Immigrants | Sudan | 33.4 /100 | #188 | Fair 88.9% |
| Immigrants | Uganda | 32.6 /100 | #189 | Fair 88.9% |
| Immigrants | Chile | 31.9 /100 | #190 | Fair 88.9% |
| Immigrants | Ethiopia | 30.9 /100 | #191 | Fair 88.9% |
| Moroccans | 29.5 /100 | #192 | Fair 88.8% |