Argentinean vs Immigrants from North America GED/Equivalency
COMPARE
Argentinean
Immigrants from North America
GED/Equivalency
GED/Equivalency Comparison
Argentineans
Immigrants from North America
86.7%
GED/EQUIVALENCY
89.7/ 100
METRIC RATING
127th/ 347
METRIC RANK
87.8%
GED/EQUIVALENCY
99.1/ 100
METRIC RATING
65th/ 347
METRIC RANK
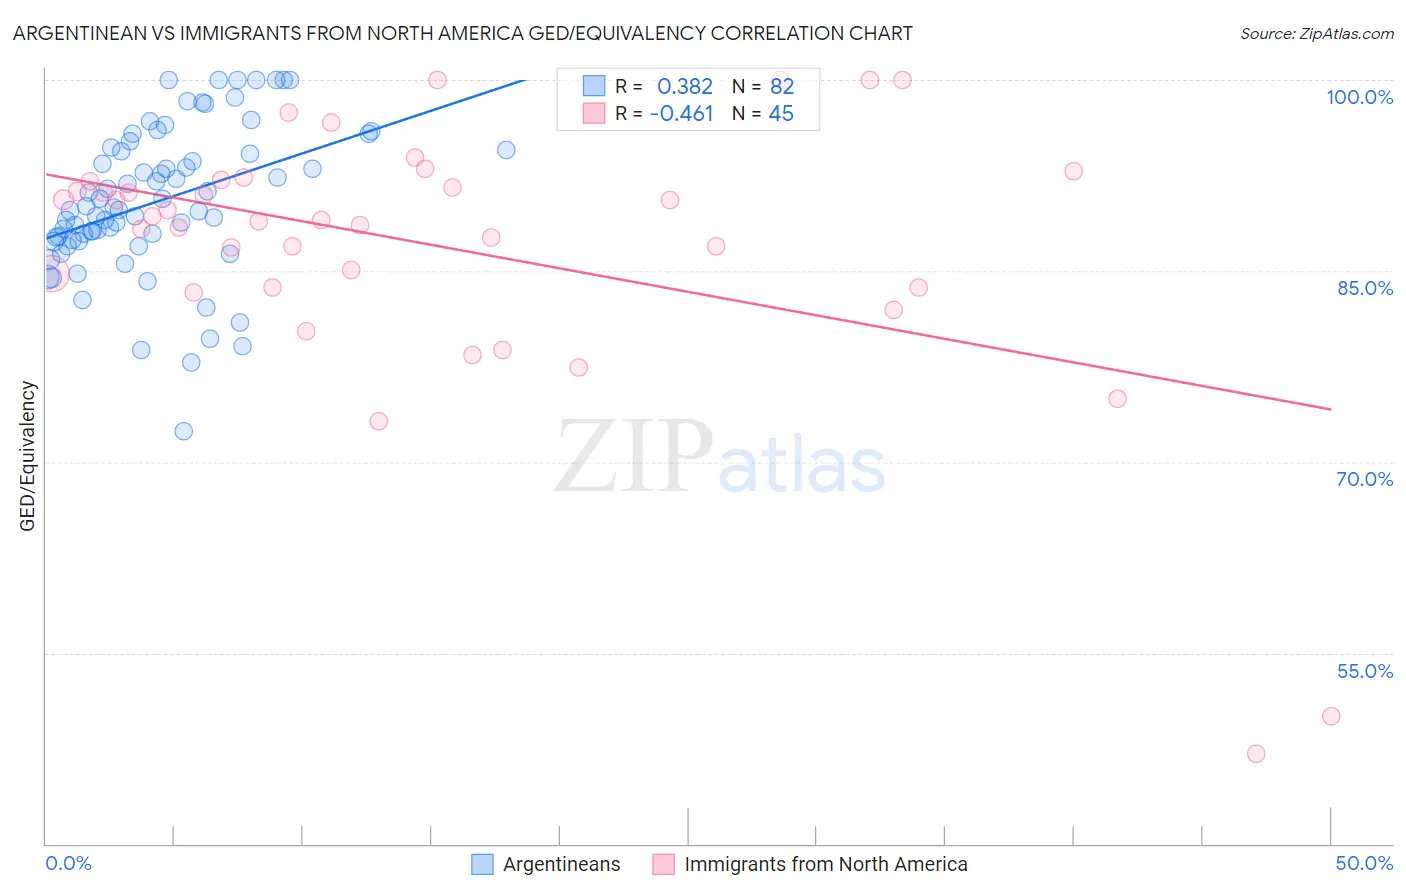
Argentinean vs Immigrants from North America GED/Equivalency Correlation Chart
The statistical analysis conducted on geographies consisting of 297,143,432 people shows a mild positive correlation between the proportion of Argentineans and percentage of population with at least ged/equivalency education in the United States with a correlation coefficient (R) of 0.382 and weighted average of 86.7%. Similarly, the statistical analysis conducted on geographies consisting of 462,461,910 people shows a moderate negative correlation between the proportion of Immigrants from North America and percentage of population with at least ged/equivalency education in the United States with a correlation coefficient (R) of -0.461 and weighted average of 87.8%, a difference of 1.3%.
GED/Equivalency Correlation Summary
| Measurement | Argentinean | Immigrants from North America |
| Minimum | 72.4% | 47.1% |
| Maximum | 100.0% | 100.0% |
| Range | 27.6% | 52.9% |
| Mean | 90.5% | 86.9% |
| Median | 89.9% | 89.0% |
| Interquartile 25% (IQ1) | 87.5% | 83.7% |
| Interquartile 75% (IQ3) | 94.5% | 92.1% |
| Interquartile Range (IQR) | 7.0% | 8.4% |
| Standard Deviation (Sample) | 5.8% | 10.5% |
| Standard Deviation (Population) | 5.7% | 10.4% |
Similar Demographics by GED/Equivalency
Demographics Similar to Argentineans by GED/Equivalency
In terms of ged/equivalency, the demographic groups most similar to Argentineans are Yugoslavian (86.7%, a difference of 0.010%), Asian (86.7%, a difference of 0.030%), Immigrants from Egypt (86.7%, a difference of 0.040%), Celtic (86.7%, a difference of 0.040%), and Immigrants from Ukraine (86.7%, a difference of 0.040%).
| Demographics | Rating | Rank | GED/Equivalency |
| Scotch-Irish | 91.6 /100 | #120 | Exceptional 86.8% |
| Immigrants | Lebanon | 90.9 /100 | #121 | Exceptional 86.8% |
| Immigrants | Jordan | 90.8 /100 | #122 | Exceptional 86.8% |
| Immigrants | Italy | 90.5 /100 | #123 | Exceptional 86.7% |
| Immigrants | Egypt | 90.4 /100 | #124 | Exceptional 86.7% |
| Celtics | 90.4 /100 | #125 | Exceptional 86.7% |
| Asians | 90.3 /100 | #126 | Exceptional 86.7% |
| Argentineans | 89.7 /100 | #127 | Excellent 86.7% |
| Yugoslavians | 89.5 /100 | #128 | Excellent 86.7% |
| Immigrants | Ukraine | 88.9 /100 | #129 | Excellent 86.7% |
| Immigrants | Germany | 88.8 /100 | #130 | Excellent 86.7% |
| Immigrants | Spain | 88.5 /100 | #131 | Excellent 86.7% |
| Immigrants | Brazil | 88.4 /100 | #132 | Excellent 86.6% |
| Tsimshian | 88.3 /100 | #133 | Excellent 86.6% |
| Albanians | 87.7 /100 | #134 | Excellent 86.6% |
Demographics Similar to Immigrants from North America by GED/Equivalency
In terms of ged/equivalency, the demographic groups most similar to Immigrants from North America are Immigrants from Bulgaria (87.8%, a difference of 0.0%), British (87.8%, a difference of 0.010%), Immigrants from France (87.8%, a difference of 0.020%), Immigrants from Canada (87.9%, a difference of 0.030%), and Immigrants from Turkey (87.9%, a difference of 0.070%).
| Demographics | Rating | Rank | GED/Equivalency |
| Northern Europeans | 99.3 /100 | #58 | Exceptional 87.9% |
| Serbians | 99.3 /100 | #59 | Exceptional 87.9% |
| Scandinavians | 99.3 /100 | #60 | Exceptional 87.9% |
| Europeans | 99.3 /100 | #61 | Exceptional 87.9% |
| Germans | 99.3 /100 | #62 | Exceptional 87.9% |
| Immigrants | Turkey | 99.2 /100 | #63 | Exceptional 87.9% |
| Immigrants | Canada | 99.2 /100 | #64 | Exceptional 87.9% |
| Immigrants | North America | 99.1 /100 | #65 | Exceptional 87.8% |
| Immigrants | Bulgaria | 99.1 /100 | #66 | Exceptional 87.8% |
| British | 99.1 /100 | #67 | Exceptional 87.8% |
| Immigrants | France | 99.1 /100 | #68 | Exceptional 87.8% |
| Immigrants | Saudi Arabia | 99.0 /100 | #69 | Exceptional 87.8% |
| Ukrainians | 98.8 /100 | #70 | Exceptional 87.7% |
| Austrians | 98.8 /100 | #71 | Exceptional 87.7% |
| Immigrants | Moldova | 98.8 /100 | #72 | Exceptional 87.7% |