Argentinean vs British West Indian GED/Equivalency
COMPARE
Argentinean
British West Indian
GED/Equivalency
GED/Equivalency Comparison
Argentineans
British West Indians
86.7%
GED/EQUIVALENCY
89.7/ 100
METRIC RATING
127th/ 347
METRIC RANK
82.0%
GED/EQUIVALENCY
0.0/ 100
METRIC RATING
293rd/ 347
METRIC RANK
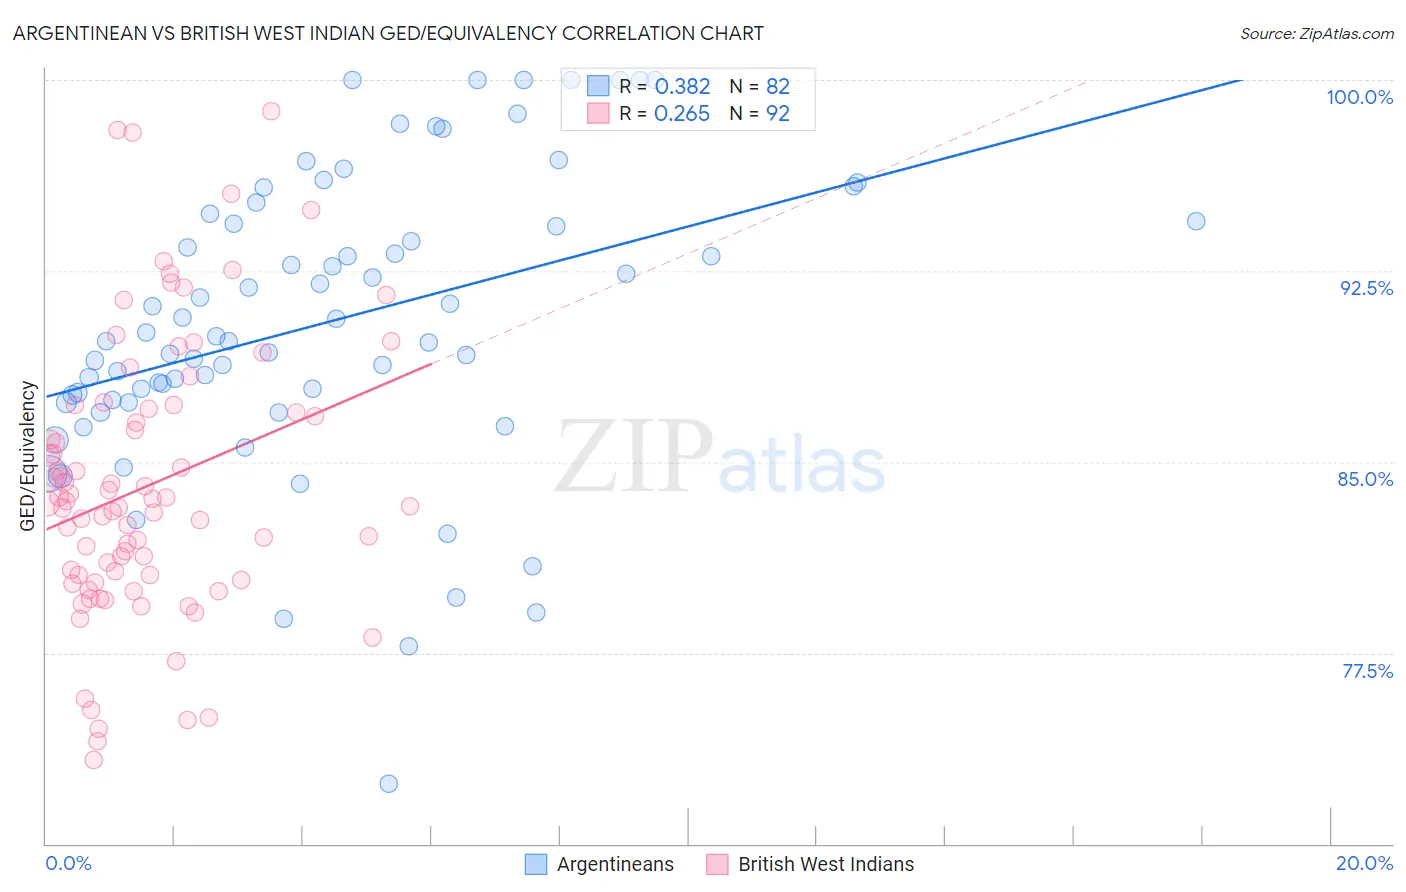
Argentinean vs British West Indian GED/Equivalency Correlation Chart
The statistical analysis conducted on geographies consisting of 297,143,432 people shows a mild positive correlation between the proportion of Argentineans and percentage of population with at least ged/equivalency education in the United States with a correlation coefficient (R) of 0.382 and weighted average of 86.7%. Similarly, the statistical analysis conducted on geographies consisting of 152,614,591 people shows a weak positive correlation between the proportion of British West Indians and percentage of population with at least ged/equivalency education in the United States with a correlation coefficient (R) of 0.265 and weighted average of 82.0%, a difference of 5.7%.
GED/Equivalency Correlation Summary
| Measurement | Argentinean | British West Indian |
| Minimum | 72.4% | 73.3% |
| Maximum | 100.0% | 98.8% |
| Range | 27.6% | 25.5% |
| Mean | 90.5% | 84.1% |
| Median | 89.9% | 83.3% |
| Interquartile 25% (IQ1) | 87.5% | 80.4% |
| Interquartile 75% (IQ3) | 94.5% | 87.0% |
| Interquartile Range (IQR) | 7.0% | 6.6% |
| Standard Deviation (Sample) | 5.8% | 5.4% |
| Standard Deviation (Population) | 5.7% | 5.4% |
Similar Demographics by GED/Equivalency
Demographics Similar to Argentineans by GED/Equivalency
In terms of ged/equivalency, the demographic groups most similar to Argentineans are Yugoslavian (86.7%, a difference of 0.010%), Asian (86.7%, a difference of 0.030%), Immigrants from Egypt (86.7%, a difference of 0.040%), Celtic (86.7%, a difference of 0.040%), and Immigrants from Ukraine (86.7%, a difference of 0.040%).
| Demographics | Rating | Rank | GED/Equivalency |
| Scotch-Irish | 91.6 /100 | #120 | Exceptional 86.8% |
| Immigrants | Lebanon | 90.9 /100 | #121 | Exceptional 86.8% |
| Immigrants | Jordan | 90.8 /100 | #122 | Exceptional 86.8% |
| Immigrants | Italy | 90.5 /100 | #123 | Exceptional 86.7% |
| Immigrants | Egypt | 90.4 /100 | #124 | Exceptional 86.7% |
| Celtics | 90.4 /100 | #125 | Exceptional 86.7% |
| Asians | 90.3 /100 | #126 | Exceptional 86.7% |
| Argentineans | 89.7 /100 | #127 | Excellent 86.7% |
| Yugoslavians | 89.5 /100 | #128 | Excellent 86.7% |
| Immigrants | Ukraine | 88.9 /100 | #129 | Excellent 86.7% |
| Immigrants | Germany | 88.8 /100 | #130 | Excellent 86.7% |
| Immigrants | Spain | 88.5 /100 | #131 | Excellent 86.7% |
| Immigrants | Brazil | 88.4 /100 | #132 | Excellent 86.6% |
| Tsimshian | 88.3 /100 | #133 | Excellent 86.6% |
| Albanians | 87.7 /100 | #134 | Excellent 86.6% |
Demographics Similar to British West Indians by GED/Equivalency
In terms of ged/equivalency, the demographic groups most similar to British West Indians are Paiute (82.0%, a difference of 0.010%), Immigrants from St. Vincent and the Grenadines (82.0%, a difference of 0.030%), Cuban (82.0%, a difference of 0.040%), Haitian (82.1%, a difference of 0.070%), and Nepalese (81.9%, a difference of 0.080%).
| Demographics | Rating | Rank | GED/Equivalency |
| Immigrants | West Indies | 0.0 /100 | #286 | Tragic 82.4% |
| Japanese | 0.0 /100 | #287 | Tragic 82.4% |
| Pueblo | 0.0 /100 | #288 | Tragic 82.3% |
| Immigrants | Cambodia | 0.0 /100 | #289 | Tragic 82.2% |
| Haitians | 0.0 /100 | #290 | Tragic 82.1% |
| Cubans | 0.0 /100 | #291 | Tragic 82.0% |
| Paiute | 0.0 /100 | #292 | Tragic 82.0% |
| British West Indians | 0.0 /100 | #293 | Tragic 82.0% |
| Immigrants | St. Vincent and the Grenadines | 0.0 /100 | #294 | Tragic 82.0% |
| Nepalese | 0.0 /100 | #295 | Tragic 81.9% |
| Vietnamese | 0.0 /100 | #296 | Tragic 81.9% |
| Immigrants | Bangladesh | 0.0 /100 | #297 | Tragic 81.9% |
| Ute | 0.0 /100 | #298 | Tragic 81.8% |
| Ecuadorians | 0.0 /100 | #299 | Tragic 81.7% |
| Fijians | 0.0 /100 | #300 | Tragic 81.6% |