Argentinean vs British West Indian Single Mother Poverty
COMPARE
Argentinean
British West Indian
Single Mother Poverty
Single Mother Poverty Comparison
Argentineans
British West Indians
27.2%
SINGLE MOTHER POVERTY
99.6/ 100
METRIC RATING
58th/ 347
METRIC RANK
31.5%
SINGLE MOTHER POVERTY
0.1/ 100
METRIC RATING
270th/ 347
METRIC RANK
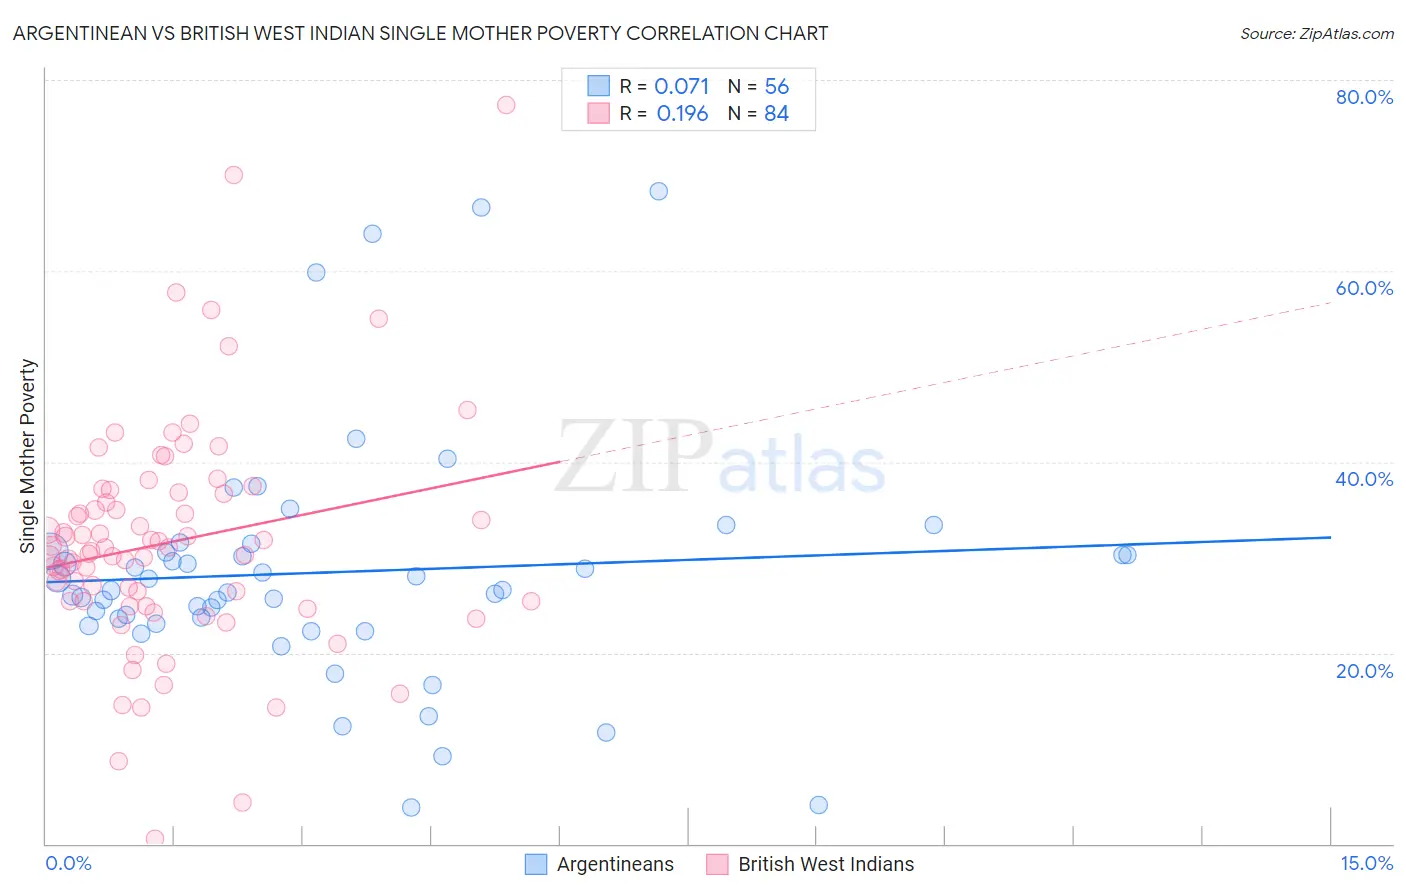
Argentinean vs British West Indian Single Mother Poverty Correlation Chart
The statistical analysis conducted on geographies consisting of 291,528,298 people shows a slight positive correlation between the proportion of Argentineans and poverty level among single mothers in the United States with a correlation coefficient (R) of 0.071 and weighted average of 27.2%. Similarly, the statistical analysis conducted on geographies consisting of 151,437,686 people shows a poor positive correlation between the proportion of British West Indians and poverty level among single mothers in the United States with a correlation coefficient (R) of 0.196 and weighted average of 31.5%, a difference of 15.8%.
Single Mother Poverty Correlation Summary
| Measurement | Argentinean | British West Indian |
| Minimum | 3.7% | 0.48% |
| Maximum | 68.3% | 77.3% |
| Range | 64.6% | 76.9% |
| Mean | 28.4% | 31.6% |
| Median | 26.5% | 30.9% |
| Interquartile 25% (IQ1) | 23.3% | 25.4% |
| Interquartile 75% (IQ3) | 30.6% | 36.7% |
| Interquartile Range (IQR) | 7.3% | 11.3% |
| Standard Deviation (Sample) | 12.7% | 12.1% |
| Standard Deviation (Population) | 12.6% | 12.0% |
Similar Demographics by Single Mother Poverty
Demographics Similar to Argentineans by Single Mother Poverty
In terms of single mother poverty, the demographic groups most similar to Argentineans are Paraguayan (27.2%, a difference of 0.010%), Eastern European (27.2%, a difference of 0.050%), Palestinian (27.2%, a difference of 0.15%), Immigrants from Eastern Europe (27.2%, a difference of 0.16%), and Immigrants from Romania (27.2%, a difference of 0.18%).
| Demographics | Rating | Rank | Single Mother Poverty |
| Immigrants | Argentina | 99.7 /100 | #51 | Exceptional 27.1% |
| Immigrants | South Eastern Asia | 99.7 /100 | #52 | Exceptional 27.1% |
| Immigrants | Jordan | 99.7 /100 | #53 | Exceptional 27.1% |
| Immigrants | Bulgaria | 99.7 /100 | #54 | Exceptional 27.1% |
| Immigrants | Egypt | 99.7 /100 | #55 | Exceptional 27.1% |
| Immigrants | Romania | 99.7 /100 | #56 | Exceptional 27.2% |
| Palestinians | 99.7 /100 | #57 | Exceptional 27.2% |
| Argentineans | 99.6 /100 | #58 | Exceptional 27.2% |
| Paraguayans | 99.6 /100 | #59 | Exceptional 27.2% |
| Eastern Europeans | 99.6 /100 | #60 | Exceptional 27.2% |
| Immigrants | Eastern Europe | 99.6 /100 | #61 | Exceptional 27.2% |
| Immigrants | Malaysia | 99.5 /100 | #62 | Exceptional 27.3% |
| Immigrants | Northern Europe | 99.5 /100 | #63 | Exceptional 27.3% |
| Russians | 99.5 /100 | #64 | Exceptional 27.3% |
| Immigrants | Turkey | 99.5 /100 | #65 | Exceptional 27.3% |
Demographics Similar to British West Indians by Single Mother Poverty
In terms of single mother poverty, the demographic groups most similar to British West Indians are Scotch-Irish (31.5%, a difference of 0.050%), Immigrants from Senegal (31.5%, a difference of 0.090%), Immigrants from Cabo Verde (31.6%, a difference of 0.24%), Immigrants from Micronesia (31.6%, a difference of 0.26%), and Immigrants from Belize (31.4%, a difference of 0.27%).
| Demographics | Rating | Rank | Single Mother Poverty |
| Bahamians | 0.2 /100 | #263 | Tragic 31.3% |
| Immigrants | Ecuador | 0.2 /100 | #264 | Tragic 31.3% |
| German Russians | 0.2 /100 | #265 | Tragic 31.3% |
| Sub-Saharan Africans | 0.2 /100 | #266 | Tragic 31.4% |
| Immigrants | Belize | 0.2 /100 | #267 | Tragic 31.4% |
| Immigrants | Senegal | 0.1 /100 | #268 | Tragic 31.5% |
| Scotch-Irish | 0.1 /100 | #269 | Tragic 31.5% |
| British West Indians | 0.1 /100 | #270 | Tragic 31.5% |
| Immigrants | Cabo Verde | 0.1 /100 | #271 | Tragic 31.6% |
| Immigrants | Micronesia | 0.1 /100 | #272 | Tragic 31.6% |
| Fijians | 0.1 /100 | #273 | Tragic 31.6% |
| Bangladeshis | 0.1 /100 | #274 | Tragic 31.7% |
| Central Americans | 0.1 /100 | #275 | Tragic 31.8% |
| Delaware | 0.0 /100 | #276 | Tragic 31.8% |
| Mexican American Indians | 0.0 /100 | #277 | Tragic 31.9% |