White/Caucasian vs Taiwanese Disability Age 65 to 74

COMPARE

White/Caucasian
Race
Ancestry
AfghanAfricanAlaska NativeAlaskan AthabascanAlbanianAleutAlsatianAmericanApacheArabArapahoArgentineanArmenianAssyrian/Chaldean/SyriacAustralianAustrianBahamianBangladeshiBarbadianBasqueBelgianBelizeanBermudanBhutaneseBlackfeetBolivianBrazilianBritishBritish West IndianBulgarianBurmeseCajunCambodianCanadianCape VerdeanCarpatho RusynCelticCentral AmericanCentral American IndianCherokeeCheyenneChickasawChileanChineseChippewaChoctawColombianColvilleComancheCosta RicanCreeCreekCroatianCrowCubanCypriotCzechCzechoslovakianDanishDelawareDominicanDutchDutch West IndianEastern EuropeanEcuadorianEgyptianEnglishEstonianEthiopianEuropeanFijianFilipinoFinnishFrenchFrench American IndianFrench CanadianGermanGerman RussianGhanaianGreekGuamanian/ChamorroGuatemalanGuyaneseHaitianHmongHonduranHopiHoumaHungarianIcelanderIndian (Asian)IndonesianInupiatIranianIraqiIrishIroquoisIsraeliItalianJamaicanJapaneseJordanianKenyanKiowaKoreanLaotianLatvianLebaneseLiberianLithuanianLumbeeLuxembourgerMacedonianMalaysianMalteseMarshalleseMenomineeMexicanMexican American IndianMongolianMoroccanNative HawaiianNavajoNepaleseNew ZealanderNicaraguanNigerianNorthern EuropeanNorwegianOkinawanOsageOttawaPaiutePakistaniPalestinianPanamanianParaguayanPennsylvania GermanPeruvianPimaPolishPortuguesePotawatomiPuebloPuerto RicanPuget Sound SalishRomanianRussianSalvadoranSamoanScandinavianScotch-IrishScottishSeminoleSenegaleseSerbianShoshoneSierra LeoneanSiouxSlavicSlovakSloveneSomaliSouth AfricanSouth AmericanSouth American IndianSoviet UnionSpaniardSpanishSpanish AmericanSpanish American IndianSri LankanSubsaharan AfricanSudaneseSwedishSwissSyrianThaiTlingit-HaidaTohono O'OdhamTonganTrinidadian and TobagonianTsimshianTurkishU.S. Virgin IslanderUgandanUkrainianUruguayanUteVenezuelanVietnameseWelshWest IndianYakamaYaquiYugoslavianYumanYup'ikZimbabwean
Immigration
NonimmigrantsImmigrantsAfghanistanAfricaAlbaniaArgentinaArmeniaAsiaAustraliaAustriaBahamasBangladeshBarbadosBelarusBelgiumBelizeBoliviaBosnia and HerzegovinaBrazilBulgariaBurma/MyanmarCabo VerdeCambodiaCameroonCanadaCaribbeanCentral AmericaChileChinaColombiaCongoCosta RicaCroatiaCubaCzechoslovakiaDenmarkDominicaDominican RepublicEastern AfricaEastern AsiaEastern EuropeEcuadorEgyptEl SalvadorEnglandEritreaEthiopiaEuropeFijiFranceGermanyGhanaGreeceGrenadaGuatemalaGuyanaHaitiHondurasHong KongHungaryIndiaIndonesiaIranIraqIrelandIsraelItalyJamaicaJapanJordanKazakhstanKenyaKoreaKuwaitLaosLatin AmericaLatviaLebanonLiberiaLithuaniaMalaysiaMexicoMicronesiaMiddle AfricaMoldovaMoroccoNepalNetherlandsNicaraguaNigeriaNorth AmericaNorth MacedoniaNorthern AfricaNorthern EuropeNorwayOceaniaPakistanPanamaPeruPhilippinesPolandPortugalRomaniaRussiaSaudi ArabiaScotlandSenegalSerbiaSierra LeoneSingaporeSomaliaSouth AfricaSouth AmericaSouth Central AsiaSouth Eastern AsiaSouthern EuropeSpainSri LankaSt. Vincent and the GrenadinesSudanSwedenSwitzerlandSyriaTaiwanThailandTrinidad and TobagoTurkeyUgandaUkraineUruguayUzbekistanVenezuelaVietnamWest IndiesWestern AfricaWestern AsiaWestern EuropeYemenZaireZimbabweAzores
Taiwanese
Race
Ancestry
AfghanAfricanAlaska NativeAlaskan AthabascanAlbanianAleutAlsatianAmericanApacheArabArapahoArgentineanArmenianAssyrian/Chaldean/SyriacAustralianAustrianBahamianBangladeshiBarbadianBasqueBelgianBelizeanBermudanBhutaneseBlackfeetBolivianBrazilianBritishBritish West IndianBulgarianBurmeseCajunCambodianCanadianCape VerdeanCarpatho RusynCelticCentral AmericanCentral American IndianCherokeeCheyenneChickasawChileanChineseChippewaChoctawColombianColvilleComancheCosta RicanCreeCreekCroatianCrowCubanCypriotCzechCzechoslovakianDanishDelawareDominicanDutchDutch West IndianEastern EuropeanEcuadorianEgyptianEnglishEstonianEthiopianEuropeanFijianFilipinoFinnishFrenchFrench American IndianFrench CanadianGermanGerman RussianGhanaianGreekGuamanian/ChamorroGuatemalanGuyaneseHaitianHmongHonduranHopiHoumaHungarianIcelanderIndian (Asian)IndonesianInupiatIranianIraqiIrishIroquoisIsraeliItalianJamaicanJapaneseJordanianKenyanKiowaKoreanLaotianLatvianLebaneseLiberianLithuanianLumbeeLuxembourgerMacedonianMalaysianMalteseMarshalleseMenomineeMexicanMexican American IndianMongolianMoroccanNative HawaiianNavajoNepaleseNew ZealanderNicaraguanNigerianNorthern EuropeanNorwegianOkinawanOsageOttawaPaiutePakistaniPalestinianPanamanianParaguayanPennsylvania GermanPeruvianPimaPolishPortuguesePotawatomiPuebloPuerto RicanPuget Sound SalishRomanianRussianSalvadoranSamoanScandinavianScotch-IrishScottishSeminoleSenegaleseSerbianShoshoneSierra LeoneanSiouxSlavicSlovakSloveneSomaliSouth AfricanSouth AmericanSouth American IndianSoviet UnionSpaniardSpanishSpanish AmericanSpanish American IndianSri LankanSubsaharan AfricanSudaneseSwedishSwissSyrianTaiwaneseThaiTlingit-HaidaTohono O'OdhamTonganTrinidadian and TobagonianTsimshianTurkishU.S. Virgin IslanderUgandanUkrainianUruguayanUteVenezuelanVietnameseWelshWest IndianYakamaYaquiYugoslavianYumanYup'ikZimbabwean
Immigration
NonimmigrantsImmigrantsAfghanistanAfricaAlbaniaArgentinaArmeniaAsiaAustraliaAustriaBahamasBangladeshBarbadosBelarusBelgiumBelizeBoliviaBosnia and HerzegovinaBrazilBulgariaBurma/MyanmarCabo VerdeCambodiaCameroonCanadaCaribbeanCentral AmericaChileChinaColombiaCongoCosta RicaCroatiaCubaCzechoslovakiaDenmarkDominicaDominican RepublicEastern AfricaEastern AsiaEastern EuropeEcuadorEgyptEl SalvadorEnglandEritreaEthiopiaEuropeFijiFranceGermanyGhanaGreeceGrenadaGuatemalaGuyanaHaitiHondurasHong KongHungaryIndiaIndonesiaIranIraqIrelandIsraelItalyJamaicaJapanJordanKazakhstanKenyaKoreaKuwaitLaosLatin AmericaLatviaLebanonLiberiaLithuaniaMalaysiaMexicoMicronesiaMiddle AfricaMoldovaMoroccoNepalNetherlandsNicaraguaNigeriaNorth AmericaNorth MacedoniaNorthern AfricaNorthern EuropeNorwayOceaniaPakistanPanamaPeruPhilippinesPolandPortugalRomaniaRussiaSaudi ArabiaScotlandSenegalSerbiaSierra LeoneSingaporeSomaliaSouth AfricaSouth AmericaSouth Central AsiaSouth Eastern AsiaSouthern EuropeSpainSri LankaSt. Vincent and the GrenadinesSudanSwedenSwitzerlandSyriaTaiwanThailandTrinidad and TobagoTurkeyUgandaUkraineUruguayUzbekistanVenezuelaVietnamWest IndiesWestern AfricaWestern AsiaWestern EuropeYemenZaireZimbabweAzores
Disability Age 65 to 74
Income
Poverty
Unemployment
Labor Participation
Family Structure
Vehicle Availability
Education Level
Disability

Disability Age 65 to 74 Comparison

Whites/Caucasians

Taiwanese

Tragic
Excellent
24.2%
DISABILITY AGE 65 TO 74
6.6/ 100
METRIC RATING
228th/ 347
METRIC RANK
22.7%
DISABILITY AGE 65 TO 74
87.6/ 100
METRIC RATING
137th/ 347
METRIC RANK

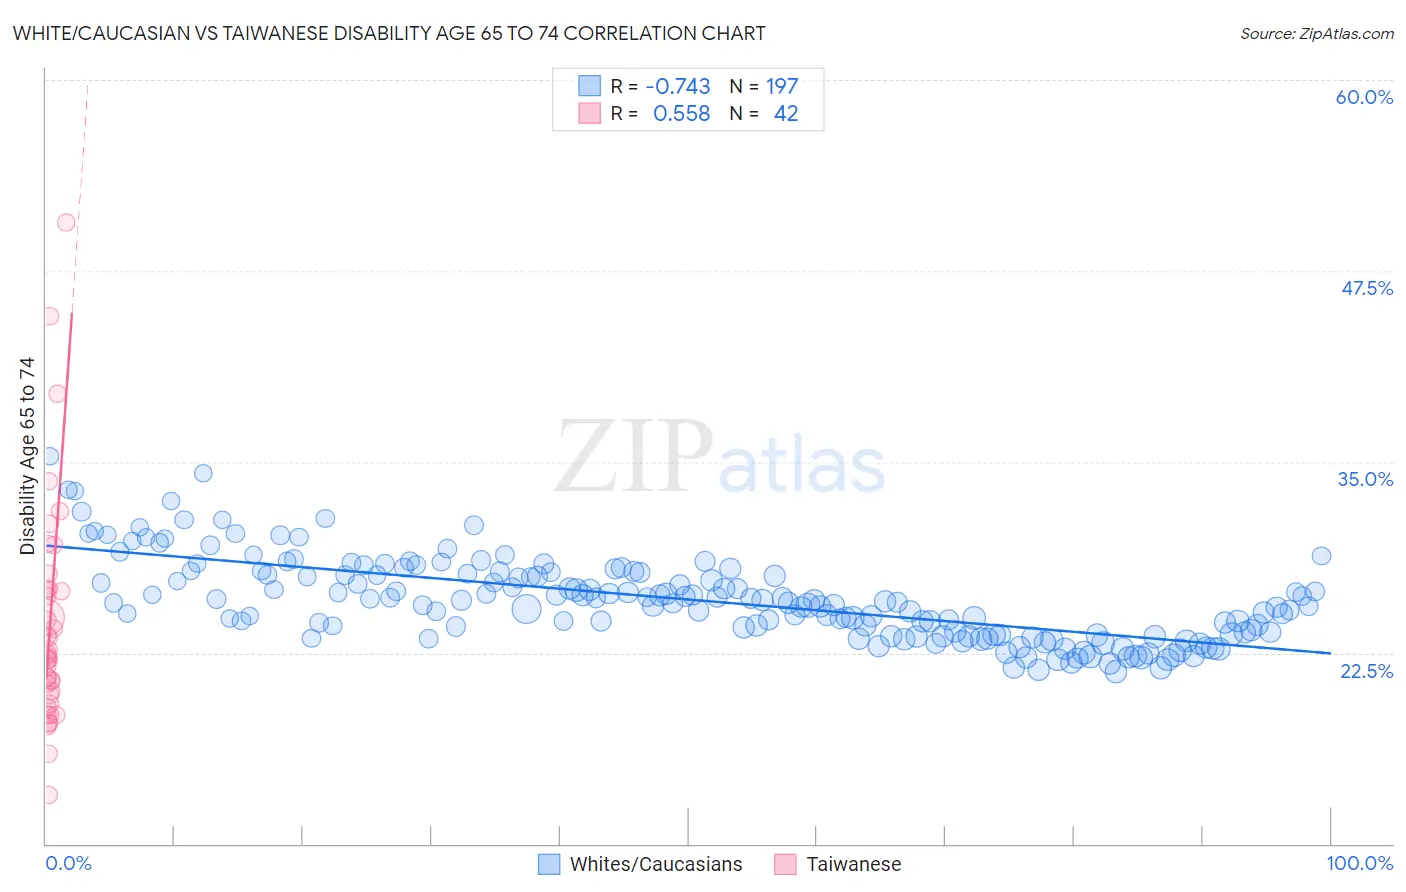
White/Caucasian vs Taiwanese Disability Age 65 to 74 Correlation Chart

The statistical analysis conducted on geographies consisting of 580,018,355 people shows a strong negative correlation between the proportion of Whites/Caucasians and percentage of population with a disability between the ages 65 and 75 in the United States with a correlation coefficient (R) of -0.743 and weighted average of 24.2%. Similarly, the statistical analysis conducted on geographies consisting of 31,708,016 people shows a substantial positive correlation between the proportion of Taiwanese and percentage of population with a disability between the ages 65 and 75 in the United States with a correlation coefficient (R) of 0.558 and weighted average of 22.7%, a difference of 6.9%.
White/Caucasian vs Taiwanese Disability Age 65 to 74

Disability Age 65 to 74 Correlation Summary

MeasurementWhite/CaucasianTaiwanese
Minimum21.3%13.2%
Maximum35.4%50.6%
Range14.1%37.5%
Mean26.0%24.3%
Median25.8%22.2%
Interquartile 25% (IQ1)23.7%19.7%
Interquartile 75% (IQ3)27.7%26.6%
Interquartile Range (IQR)4.0%6.9%
Standard Deviation (Sample)2.7%7.4%
Standard Deviation (Population)2.7%7.3%

Similar Demographics by Disability Age 65 to 74

Demographics Similar to Whites/Caucasians by Disability Age 65 to 74

In terms of disability age 65 to 74, the demographic groups most similar to Whites/Caucasians are Celtic (24.2%, a difference of 0.050%), Barbadian (24.3%, a difference of 0.16%), Nigerian (24.2%, a difference of 0.25%), Iraqi (24.2%, a difference of 0.31%), and Bermudan (24.2%, a difference of 0.32%).
DemographicsRating | RankDisability Age 65 to 74
Immigrants | Nicaragua
9.8
/100
|
#221
Tragic
24.1%
Native Hawaiians
9.3
/100
|
#222
Tragic
24.1%
Immigrants | Middle Africa
8.9
/100
|
#223
Tragic
24.1%
Immigrants | Panama
8.6
/100
|
#224
Tragic
24.1%
Bermudans
8.2
/100
|
#225
Tragic
24.2%
Iraqis
8.1
/100
|
#226
Tragic
24.2%
Nigerians
7.8
/100
|
#227
Tragic
24.2%
Whites/Caucasians
6.6
/100
|
#228
Tragic
24.2%
Celtics
6.4
/100
|
#229
Tragic
24.2%
Barbadians
6.0
/100
|
#230
Tragic
24.3%
Immigrants | Thailand
5.2
/100
|
#231
Tragic
24.3%
Immigrants | Zaire
5.0
/100
|
#232
Tragic
24.3%
Bahamians
4.5
/100
|
#233
Tragic
24.4%
Panamanians
4.2
/100
|
#234
Tragic
24.4%
Scotch-Irish
3.8
/100
|
#235
Tragic
24.4%

Demographics Similar to Taiwanese by Disability Age 65 to 74

In terms of disability age 65 to 74, the demographic groups most similar to Taiwanese are Ethiopian (22.7%, a difference of 0.030%), Immigrants from Moldova (22.7%, a difference of 0.050%), Immigrants from Ukraine (22.6%, a difference of 0.10%), Afghan (22.6%, a difference of 0.14%), and Northern European (22.6%, a difference of 0.19%).
DemographicsRating | RankDisability Age 65 to 74
Immigrants | Albania
90.0
/100
|
#130
Excellent
22.6%
Immigrants | Nepal
89.4
/100
|
#131
Excellent
22.6%
Costa Ricans
89.2
/100
|
#132
Excellent
22.6%
Northern Europeans
88.9
/100
|
#133
Excellent
22.6%
Afghans
88.6
/100
|
#134
Excellent
22.6%
Immigrants | Ukraine
88.4
/100
|
#135
Excellent
22.6%
Ethiopians
87.9
/100
|
#136
Excellent
22.7%
Taiwanese
87.6
/100
|
#137
Excellent
22.7%
Immigrants | Moldova
87.3
/100
|
#138
Excellent
22.7%
Immigrants | Syria
85.8
/100
|
#139
Excellent
22.7%
Ugandans
85.4
/100
|
#140
Excellent
22.7%
Belgians
85.3
/100
|
#141
Excellent
22.7%
Immigrants | Ethiopia
85.3
/100
|
#142
Excellent
22.7%
Arabs
84.8
/100
|
#143
Excellent
22.8%
Danes
84.4
/100
|
#144
Excellent
22.8%