White/Caucasian vs Laotian Disability Age 65 to 74
COMPARE
White/Caucasian
Laotian
Disability Age 65 to 74
Disability Age 65 to 74 Comparison
Whites/Caucasians
Laotians
24.2%
DISABILITY AGE 65 TO 74
6.6/ 100
METRIC RATING
228th/ 347
METRIC RANK
22.3%
DISABILITY AGE 65 TO 74
94.9/ 100
METRIC RATING
115th/ 347
METRIC RANK
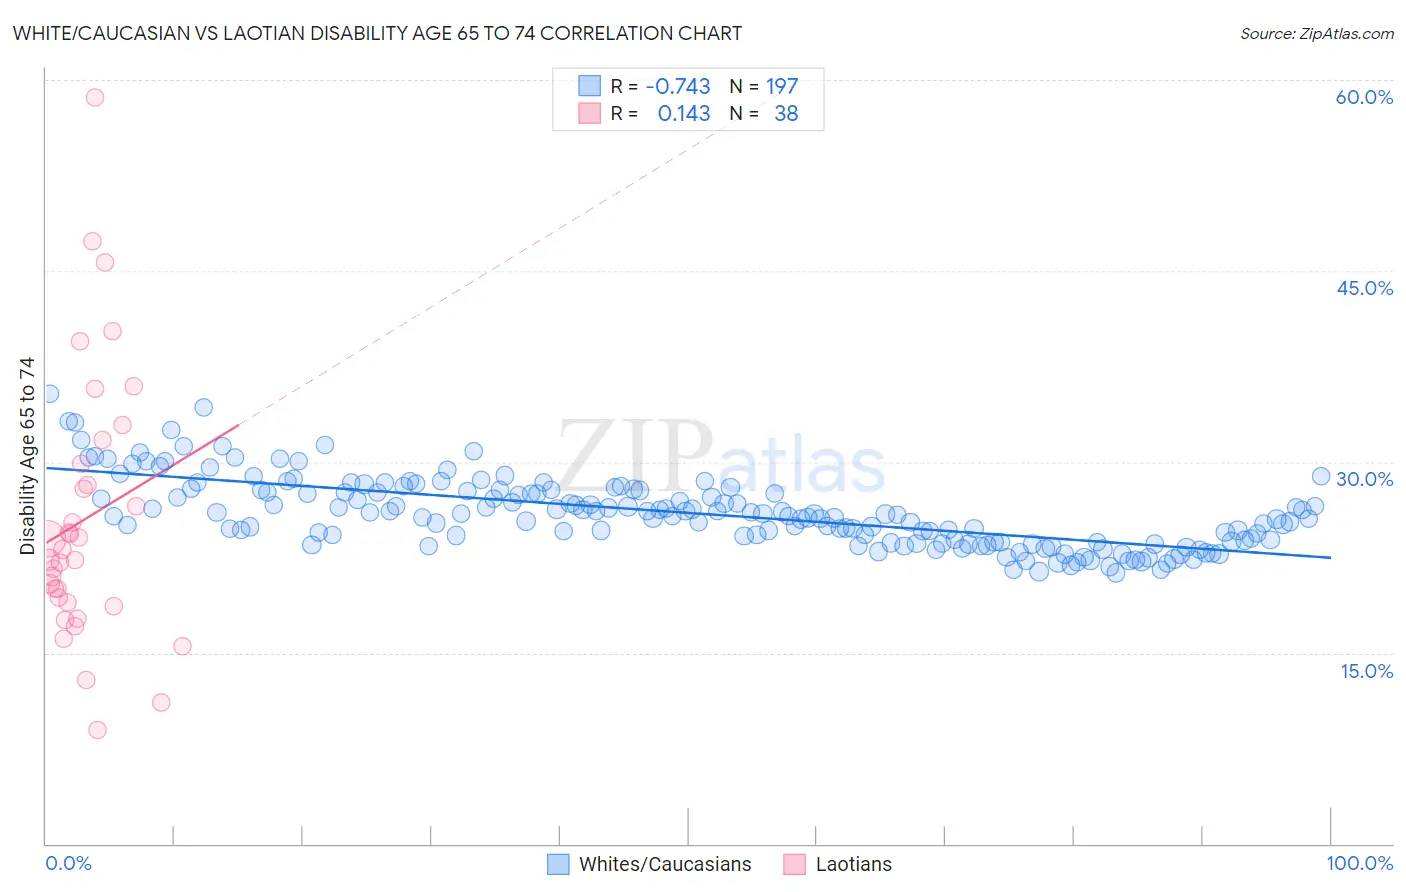
White/Caucasian vs Laotian Disability Age 65 to 74 Correlation Chart
The statistical analysis conducted on geographies consisting of 580,018,355 people shows a strong negative correlation between the proportion of Whites/Caucasians and percentage of population with a disability between the ages 65 and 75 in the United States with a correlation coefficient (R) of -0.743 and weighted average of 24.2%. Similarly, the statistical analysis conducted on geographies consisting of 224,537,885 people shows a poor positive correlation between the proportion of Laotians and percentage of population with a disability between the ages 65 and 75 in the United States with a correlation coefficient (R) of 0.143 and weighted average of 22.3%, a difference of 8.5%.
Disability Age 65 to 74 Correlation Summary
| Measurement | White/Caucasian | Laotian |
| Minimum | 21.3% | 8.9% |
| Maximum | 35.4% | 58.7% |
| Range | 14.1% | 49.8% |
| Mean | 26.0% | 25.5% |
| Median | 25.8% | 22.7% |
| Interquartile 25% (IQ1) | 23.7% | 19.0% |
| Interquartile 75% (IQ3) | 27.7% | 29.9% |
| Interquartile Range (IQR) | 4.0% | 10.9% |
| Standard Deviation (Sample) | 2.7% | 10.5% |
| Standard Deviation (Population) | 2.7% | 10.3% |
Similar Demographics by Disability Age 65 to 74
Demographics Similar to Whites/Caucasians by Disability Age 65 to 74
In terms of disability age 65 to 74, the demographic groups most similar to Whites/Caucasians are Celtic (24.2%, a difference of 0.050%), Barbadian (24.3%, a difference of 0.16%), Nigerian (24.2%, a difference of 0.25%), Iraqi (24.2%, a difference of 0.31%), and Bermudan (24.2%, a difference of 0.32%).
| Demographics | Rating | Rank | Disability Age 65 to 74 |
| Immigrants | Nicaragua | 9.8 /100 | #221 | Tragic 24.1% |
| Native Hawaiians | 9.3 /100 | #222 | Tragic 24.1% |
| Immigrants | Middle Africa | 8.9 /100 | #223 | Tragic 24.1% |
| Immigrants | Panama | 8.6 /100 | #224 | Tragic 24.1% |
| Bermudans | 8.2 /100 | #225 | Tragic 24.2% |
| Iraqis | 8.1 /100 | #226 | Tragic 24.2% |
| Nigerians | 7.8 /100 | #227 | Tragic 24.2% |
| Whites/Caucasians | 6.6 /100 | #228 | Tragic 24.2% |
| Celtics | 6.4 /100 | #229 | Tragic 24.2% |
| Barbadians | 6.0 /100 | #230 | Tragic 24.3% |
| Immigrants | Thailand | 5.2 /100 | #231 | Tragic 24.3% |
| Immigrants | Zaire | 5.0 /100 | #232 | Tragic 24.3% |
| Bahamians | 4.5 /100 | #233 | Tragic 24.4% |
| Panamanians | 4.2 /100 | #234 | Tragic 24.4% |
| Scotch-Irish | 3.8 /100 | #235 | Tragic 24.4% |
Demographics Similar to Laotians by Disability Age 65 to 74
In terms of disability age 65 to 74, the demographic groups most similar to Laotians are Brazilian (22.4%, a difference of 0.040%), Swedish (22.4%, a difference of 0.050%), Ukrainian (22.3%, a difference of 0.060%), Austrian (22.4%, a difference of 0.060%), and Immigrants from Northern Africa (22.4%, a difference of 0.060%).
| Demographics | Rating | Rank | Disability Age 65 to 74 |
| Immigrants | Zimbabwe | 96.1 /100 | #108 | Exceptional 22.3% |
| Albanians | 95.8 /100 | #109 | Exceptional 22.3% |
| Immigrants | Peru | 95.7 /100 | #110 | Exceptional 22.3% |
| Serbians | 95.7 /100 | #111 | Exceptional 22.3% |
| Immigrants | South America | 95.5 /100 | #112 | Exceptional 22.3% |
| Syrians | 95.3 /100 | #113 | Exceptional 22.3% |
| Ukrainians | 95.1 /100 | #114 | Exceptional 22.3% |
| Laotians | 94.9 /100 | #115 | Exceptional 22.3% |
| Brazilians | 94.8 /100 | #116 | Exceptional 22.4% |
| Swedes | 94.7 /100 | #117 | Exceptional 22.4% |
| Austrians | 94.7 /100 | #118 | Exceptional 22.4% |
| Immigrants | Northern Africa | 94.7 /100 | #119 | Exceptional 22.4% |
| Immigrants | Kazakhstan | 93.9 /100 | #120 | Exceptional 22.4% |
| Czechs | 93.5 /100 | #121 | Exceptional 22.4% |
| Immigrants | Jordan | 93.5 /100 | #122 | Exceptional 22.4% |