Immigrants from Uganda vs Taiwanese Disability Age 65 to 74
COMPARE
Immigrants from Uganda
Taiwanese
Disability Age 65 to 74
Disability Age 65 to 74 Comparison
Immigrants from Uganda
Taiwanese
22.8%
DISABILITY AGE 65 TO 74
84.0/ 100
METRIC RATING
145th/ 347
METRIC RANK
22.7%
DISABILITY AGE 65 TO 74
87.6/ 100
METRIC RATING
137th/ 347
METRIC RANK
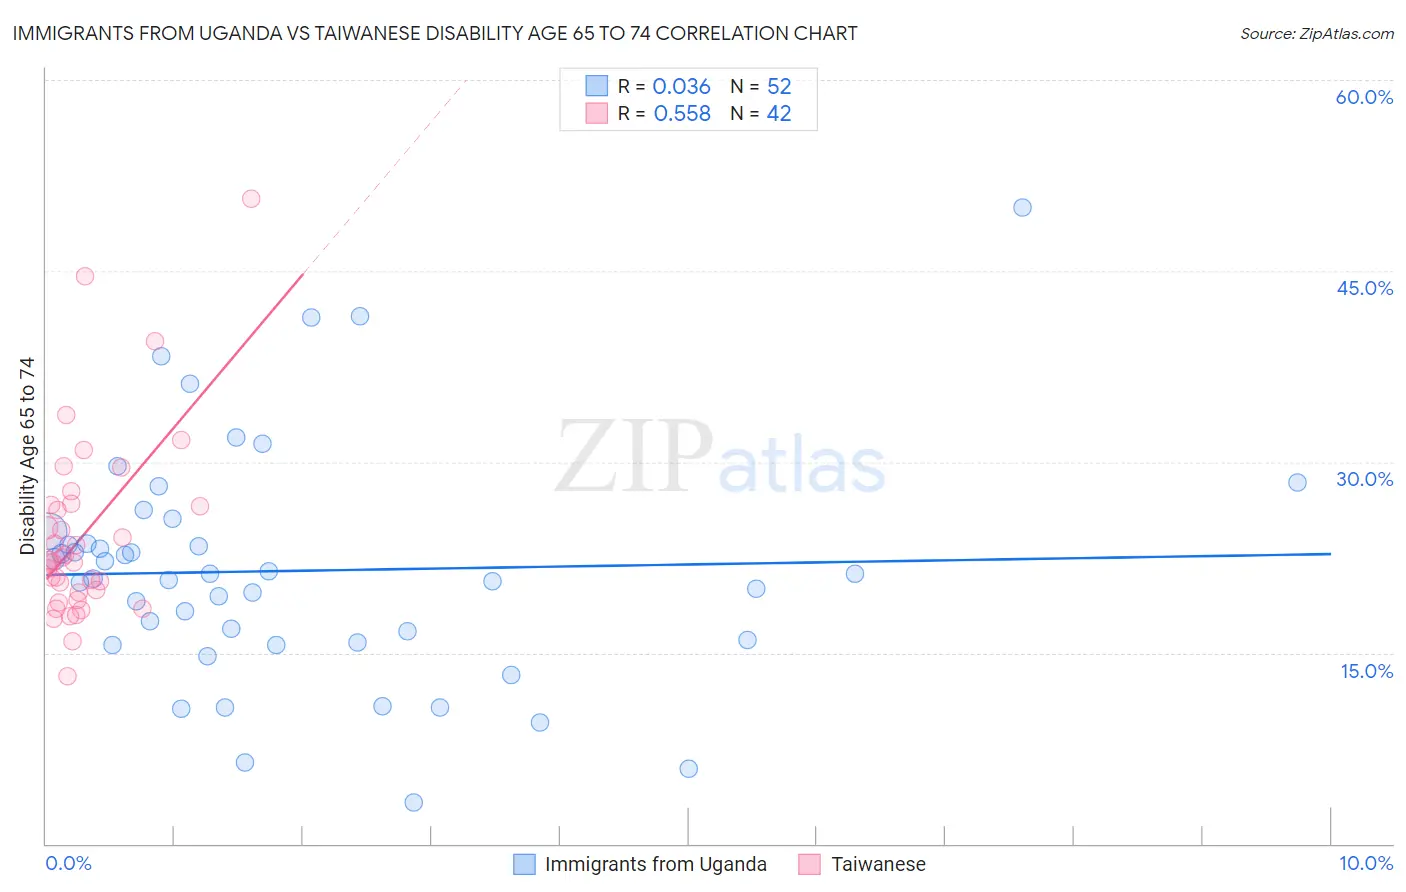
Immigrants from Uganda vs Taiwanese Disability Age 65 to 74 Correlation Chart
The statistical analysis conducted on geographies consisting of 125,925,118 people shows no correlation between the proportion of Immigrants from Uganda and percentage of population with a disability between the ages 65 and 75 in the United States with a correlation coefficient (R) of 0.036 and weighted average of 22.8%. Similarly, the statistical analysis conducted on geographies consisting of 31,708,016 people shows a substantial positive correlation between the proportion of Taiwanese and percentage of population with a disability between the ages 65 and 75 in the United States with a correlation coefficient (R) of 0.558 and weighted average of 22.7%, a difference of 0.45%.
Disability Age 65 to 74 Correlation Summary
| Measurement | Immigrants from Uganda | Taiwanese |
| Minimum | 3.2% | 13.2% |
| Maximum | 50.0% | 50.6% |
| Range | 46.8% | 37.5% |
| Mean | 21.4% | 24.3% |
| Median | 21.0% | 22.2% |
| Interquartile 25% (IQ1) | 15.9% | 19.7% |
| Interquartile 75% (IQ3) | 24.1% | 26.6% |
| Interquartile Range (IQR) | 8.2% | 6.9% |
| Standard Deviation (Sample) | 9.2% | 7.4% |
| Standard Deviation (Population) | 9.1% | 7.3% |
Demographics Similar to Immigrants from Uganda and Taiwanese by Disability Age 65 to 74
In terms of disability age 65 to 74, the demographic groups most similar to Immigrants from Uganda are Alsatian (22.8%, a difference of 0.030%), Danish (22.8%, a difference of 0.040%), Arab (22.8%, a difference of 0.080%), Immigrants from Uzbekistan (22.8%, a difference of 0.10%), and Belgian (22.7%, a difference of 0.15%). Similarly, the demographic groups most similar to Taiwanese are Ethiopian (22.7%, a difference of 0.030%), Immigrants from Moldova (22.7%, a difference of 0.050%), Immigrants from Ukraine (22.6%, a difference of 0.10%), Afghan (22.6%, a difference of 0.14%), and Northern European (22.6%, a difference of 0.19%).
| Demographics | Rating | Rank | Disability Age 65 to 74 |
| Immigrants | Nepal | 89.4 /100 | #131 | Excellent 22.6% |
| Costa Ricans | 89.2 /100 | #132 | Excellent 22.6% |
| Northern Europeans | 88.9 /100 | #133 | Excellent 22.6% |
| Afghans | 88.6 /100 | #134 | Excellent 22.6% |
| Immigrants | Ukraine | 88.4 /100 | #135 | Excellent 22.6% |
| Ethiopians | 87.9 /100 | #136 | Excellent 22.7% |
| Taiwanese | 87.6 /100 | #137 | Excellent 22.7% |
| Immigrants | Moldova | 87.3 /100 | #138 | Excellent 22.7% |
| Immigrants | Syria | 85.8 /100 | #139 | Excellent 22.7% |
| Ugandans | 85.4 /100 | #140 | Excellent 22.7% |
| Belgians | 85.3 /100 | #141 | Excellent 22.7% |
| Immigrants | Ethiopia | 85.3 /100 | #142 | Excellent 22.7% |
| Arabs | 84.8 /100 | #143 | Excellent 22.8% |
| Danes | 84.4 /100 | #144 | Excellent 22.8% |
| Immigrants | Uganda | 84.0 /100 | #145 | Excellent 22.8% |
| Alsatians | 83.7 /100 | #146 | Excellent 22.8% |
| Immigrants | Uzbekistan | 83.1 /100 | #147 | Excellent 22.8% |
| New Zealanders | 79.9 /100 | #148 | Good 22.9% |
| Swiss | 79.7 /100 | #149 | Good 22.9% |
| Canadians | 77.7 /100 | #150 | Good 22.9% |
| Immigrants | Morocco | 77.6 /100 | #151 | Good 22.9% |