White/Caucasian vs British Disability Age 65 to 74
COMPARE
White/Caucasian
British
Disability Age 65 to 74
Disability Age 65 to 74 Comparison
Whites/Caucasians
British
24.2%
DISABILITY AGE 65 TO 74
6.6/ 100
METRIC RATING
228th/ 347
METRIC RANK
23.0%
DISABILITY AGE 65 TO 74
73.9/ 100
METRIC RATING
155th/ 347
METRIC RANK
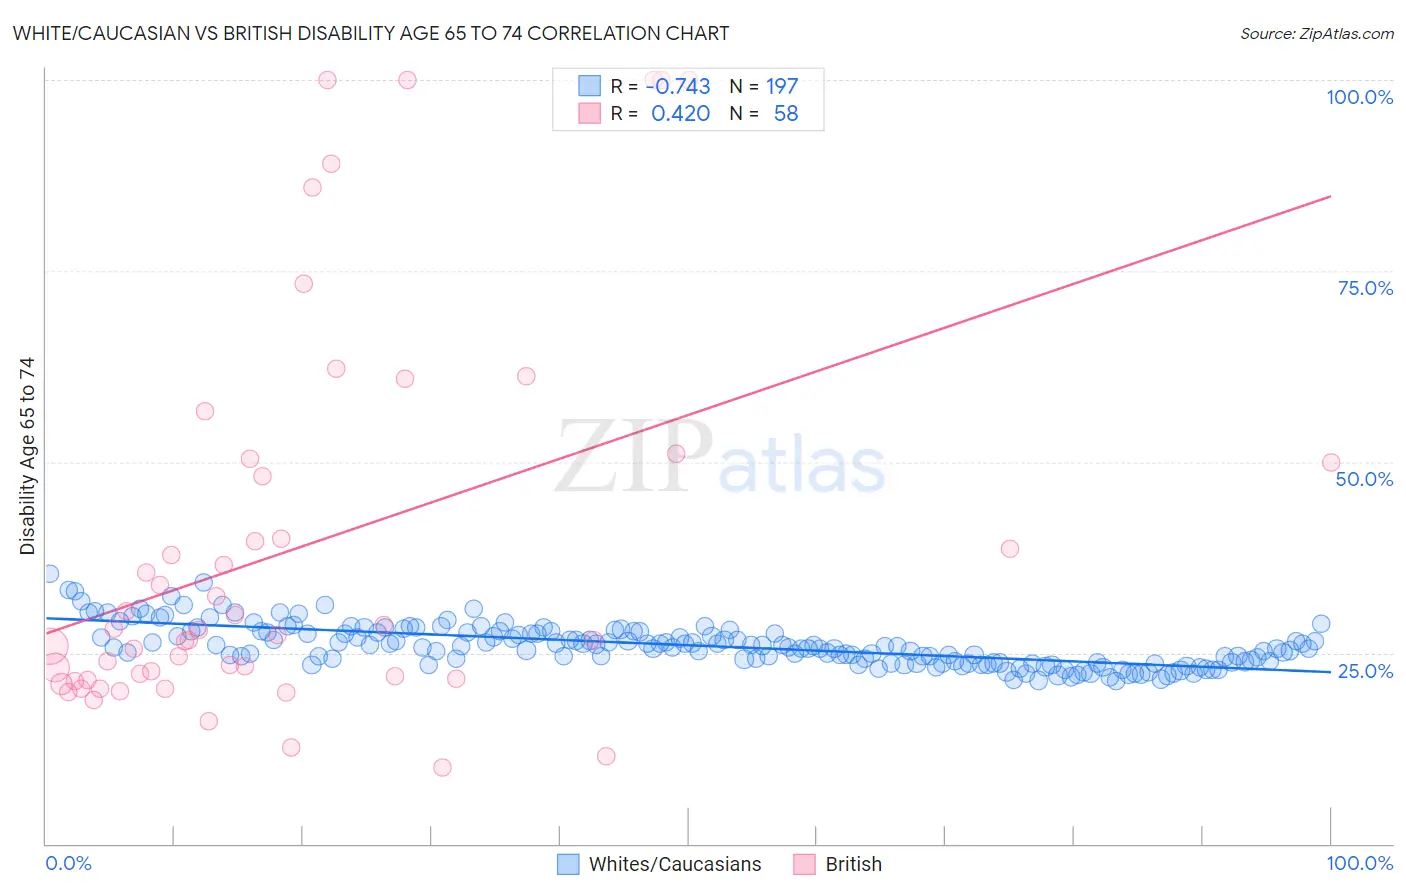
White/Caucasian vs British Disability Age 65 to 74 Correlation Chart
The statistical analysis conducted on geographies consisting of 580,018,355 people shows a strong negative correlation between the proportion of Whites/Caucasians and percentage of population with a disability between the ages 65 and 75 in the United States with a correlation coefficient (R) of -0.743 and weighted average of 24.2%. Similarly, the statistical analysis conducted on geographies consisting of 529,866,970 people shows a moderate positive correlation between the proportion of British and percentage of population with a disability between the ages 65 and 75 in the United States with a correlation coefficient (R) of 0.420 and weighted average of 23.0%, a difference of 5.4%.
Disability Age 65 to 74 Correlation Summary
| Measurement | White/Caucasian | British |
| Minimum | 21.3% | 10.0% |
| Maximum | 35.4% | 100.0% |
| Range | 14.1% | 90.0% |
| Mean | 26.0% | 38.7% |
| Median | 25.8% | 27.6% |
| Interquartile 25% (IQ1) | 23.7% | 21.6% |
| Interquartile 75% (IQ3) | 27.7% | 50.0% |
| Interquartile Range (IQR) | 4.0% | 28.4% |
| Standard Deviation (Sample) | 2.7% | 25.5% |
| Standard Deviation (Population) | 2.7% | 25.2% |
Similar Demographics by Disability Age 65 to 74
Demographics Similar to Whites/Caucasians by Disability Age 65 to 74
In terms of disability age 65 to 74, the demographic groups most similar to Whites/Caucasians are Celtic (24.2%, a difference of 0.050%), Barbadian (24.3%, a difference of 0.16%), Nigerian (24.2%, a difference of 0.25%), Iraqi (24.2%, a difference of 0.31%), and Bermudan (24.2%, a difference of 0.32%).
| Demographics | Rating | Rank | Disability Age 65 to 74 |
| Immigrants | Nicaragua | 9.8 /100 | #221 | Tragic 24.1% |
| Native Hawaiians | 9.3 /100 | #222 | Tragic 24.1% |
| Immigrants | Middle Africa | 8.9 /100 | #223 | Tragic 24.1% |
| Immigrants | Panama | 8.6 /100 | #224 | Tragic 24.1% |
| Bermudans | 8.2 /100 | #225 | Tragic 24.2% |
| Iraqis | 8.1 /100 | #226 | Tragic 24.2% |
| Nigerians | 7.8 /100 | #227 | Tragic 24.2% |
| Whites/Caucasians | 6.6 /100 | #228 | Tragic 24.2% |
| Celtics | 6.4 /100 | #229 | Tragic 24.2% |
| Barbadians | 6.0 /100 | #230 | Tragic 24.3% |
| Immigrants | Thailand | 5.2 /100 | #231 | Tragic 24.3% |
| Immigrants | Zaire | 5.0 /100 | #232 | Tragic 24.3% |
| Bahamians | 4.5 /100 | #233 | Tragic 24.4% |
| Panamanians | 4.2 /100 | #234 | Tragic 24.4% |
| Scotch-Irish | 3.8 /100 | #235 | Tragic 24.4% |
Demographics Similar to British by Disability Age 65 to 74
In terms of disability age 65 to 74, the demographic groups most similar to British are Sri Lankan (23.0%, a difference of 0.010%), Immigrants from Western Asia (23.0%, a difference of 0.010%), Slavic (23.0%, a difference of 0.10%), Czechoslovakian (23.0%, a difference of 0.11%), and Finnish (22.9%, a difference of 0.21%).
| Demographics | Rating | Rank | Disability Age 65 to 74 |
| New Zealanders | 79.9 /100 | #148 | Good 22.9% |
| Swiss | 79.7 /100 | #149 | Good 22.9% |
| Canadians | 77.7 /100 | #150 | Good 22.9% |
| Immigrants | Morocco | 77.6 /100 | #151 | Good 22.9% |
| Finns | 76.5 /100 | #152 | Good 22.9% |
| Slavs | 75.2 /100 | #153 | Good 23.0% |
| Sri Lankans | 74.0 /100 | #154 | Good 23.0% |
| British | 73.9 /100 | #155 | Good 23.0% |
| Immigrants | Western Asia | 73.8 /100 | #156 | Good 23.0% |
| Czechoslovakians | 72.4 /100 | #157 | Good 23.0% |
| Immigrants | Vietnam | 69.1 /100 | #158 | Good 23.1% |
| South American Indians | 65.5 /100 | #159 | Good 23.1% |
| Koreans | 64.2 /100 | #160 | Good 23.1% |
| Immigrants | Cameroon | 63.8 /100 | #161 | Good 23.1% |
| Europeans | 61.2 /100 | #162 | Good 23.2% |