White/Caucasian vs Cape Verdean Disability Age 65 to 74
COMPARE
White/Caucasian
Cape Verdean
Disability Age 65 to 74
Disability Age 65 to 74 Comparison
Whites/Caucasians
Cape Verdeans
24.2%
DISABILITY AGE 65 TO 74
6.6/ 100
METRIC RATING
228th/ 347
METRIC RANK
25.4%
DISABILITY AGE 65 TO 74
0.2/ 100
METRIC RATING
261st/ 347
METRIC RANK
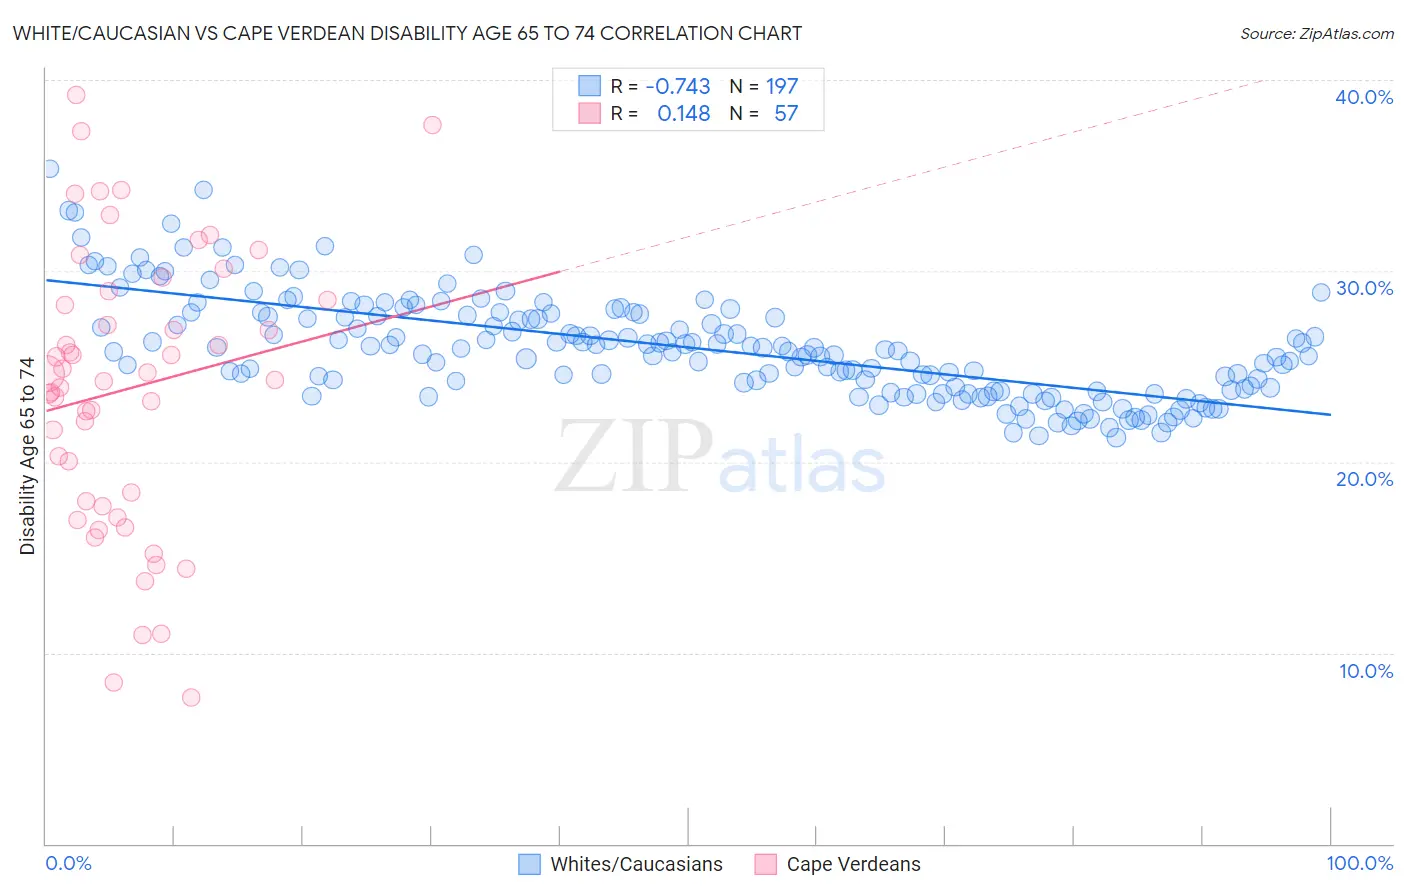
White/Caucasian vs Cape Verdean Disability Age 65 to 74 Correlation Chart
The statistical analysis conducted on geographies consisting of 580,018,355 people shows a strong negative correlation between the proportion of Whites/Caucasians and percentage of population with a disability between the ages 65 and 75 in the United States with a correlation coefficient (R) of -0.743 and weighted average of 24.2%. Similarly, the statistical analysis conducted on geographies consisting of 107,487,290 people shows a poor positive correlation between the proportion of Cape Verdeans and percentage of population with a disability between the ages 65 and 75 in the United States with a correlation coefficient (R) of 0.148 and weighted average of 25.4%, a difference of 4.9%.
Disability Age 65 to 74 Correlation Summary
| Measurement | White/Caucasian | Cape Verdean |
| Minimum | 21.3% | 7.7% |
| Maximum | 35.4% | 39.2% |
| Range | 14.1% | 31.5% |
| Mean | 26.0% | 23.8% |
| Median | 25.8% | 24.3% |
| Interquartile 25% (IQ1) | 23.7% | 17.8% |
| Interquartile 75% (IQ3) | 27.7% | 28.7% |
| Interquartile Range (IQR) | 4.0% | 10.9% |
| Standard Deviation (Sample) | 2.7% | 7.3% |
| Standard Deviation (Population) | 2.7% | 7.3% |
Similar Demographics by Disability Age 65 to 74
Demographics Similar to Whites/Caucasians by Disability Age 65 to 74
In terms of disability age 65 to 74, the demographic groups most similar to Whites/Caucasians are Celtic (24.2%, a difference of 0.050%), Barbadian (24.3%, a difference of 0.16%), Nigerian (24.2%, a difference of 0.25%), Iraqi (24.2%, a difference of 0.31%), and Bermudan (24.2%, a difference of 0.32%).
| Demographics | Rating | Rank | Disability Age 65 to 74 |
| Immigrants | Nicaragua | 9.8 /100 | #221 | Tragic 24.1% |
| Native Hawaiians | 9.3 /100 | #222 | Tragic 24.1% |
| Immigrants | Middle Africa | 8.9 /100 | #223 | Tragic 24.1% |
| Immigrants | Panama | 8.6 /100 | #224 | Tragic 24.1% |
| Bermudans | 8.2 /100 | #225 | Tragic 24.2% |
| Iraqis | 8.1 /100 | #226 | Tragic 24.2% |
| Nigerians | 7.8 /100 | #227 | Tragic 24.2% |
| Whites/Caucasians | 6.6 /100 | #228 | Tragic 24.2% |
| Celtics | 6.4 /100 | #229 | Tragic 24.2% |
| Barbadians | 6.0 /100 | #230 | Tragic 24.3% |
| Immigrants | Thailand | 5.2 /100 | #231 | Tragic 24.3% |
| Immigrants | Zaire | 5.0 /100 | #232 | Tragic 24.3% |
| Bahamians | 4.5 /100 | #233 | Tragic 24.4% |
| Panamanians | 4.2 /100 | #234 | Tragic 24.4% |
| Scotch-Irish | 3.8 /100 | #235 | Tragic 24.4% |
Demographics Similar to Cape Verdeans by Disability Age 65 to 74
In terms of disability age 65 to 74, the demographic groups most similar to Cape Verdeans are Malaysian (25.4%, a difference of 0.080%), Samoan (25.4%, a difference of 0.10%), Iroquois (25.4%, a difference of 0.10%), Immigrants from Cambodia (25.3%, a difference of 0.40%), and Hawaiian (25.5%, a difference of 0.45%).
| Demographics | Rating | Rank | Disability Age 65 to 74 |
| Somalis | 0.6 /100 | #254 | Tragic 25.1% |
| Central Americans | 0.5 /100 | #255 | Tragic 25.1% |
| Immigrants | Somalia | 0.4 /100 | #256 | Tragic 25.2% |
| Guamanians/Chamorros | 0.3 /100 | #257 | Tragic 25.3% |
| Marshallese | 0.3 /100 | #258 | Tragic 25.3% |
| Immigrants | Cambodia | 0.3 /100 | #259 | Tragic 25.3% |
| Malaysians | 0.2 /100 | #260 | Tragic 25.4% |
| Cape Verdeans | 0.2 /100 | #261 | Tragic 25.4% |
| Samoans | 0.2 /100 | #262 | Tragic 25.4% |
| Iroquois | 0.2 /100 | #263 | Tragic 25.4% |
| Hawaiians | 0.2 /100 | #264 | Tragic 25.5% |
| Guatemalans | 0.2 /100 | #265 | Tragic 25.5% |
| Immigrants | Latin America | 0.1 /100 | #266 | Tragic 25.6% |
| Ottawa | 0.1 /100 | #267 | Tragic 25.6% |
| Liberians | 0.1 /100 | #268 | Tragic 25.6% |