Tohono O'odham vs Cypriot Female Disability
COMPARE
Tohono O'odham
Cypriot
Female Disability
Female Disability Comparison
Tohono O'odham
Cypriots
15.0%
FEMALE DISABILITY
0.0/ 100
METRIC RATING
337th/ 347
METRIC RANK
11.2%
FEMALE DISABILITY
100.0/ 100
METRIC RATING
36th/ 347
METRIC RANK
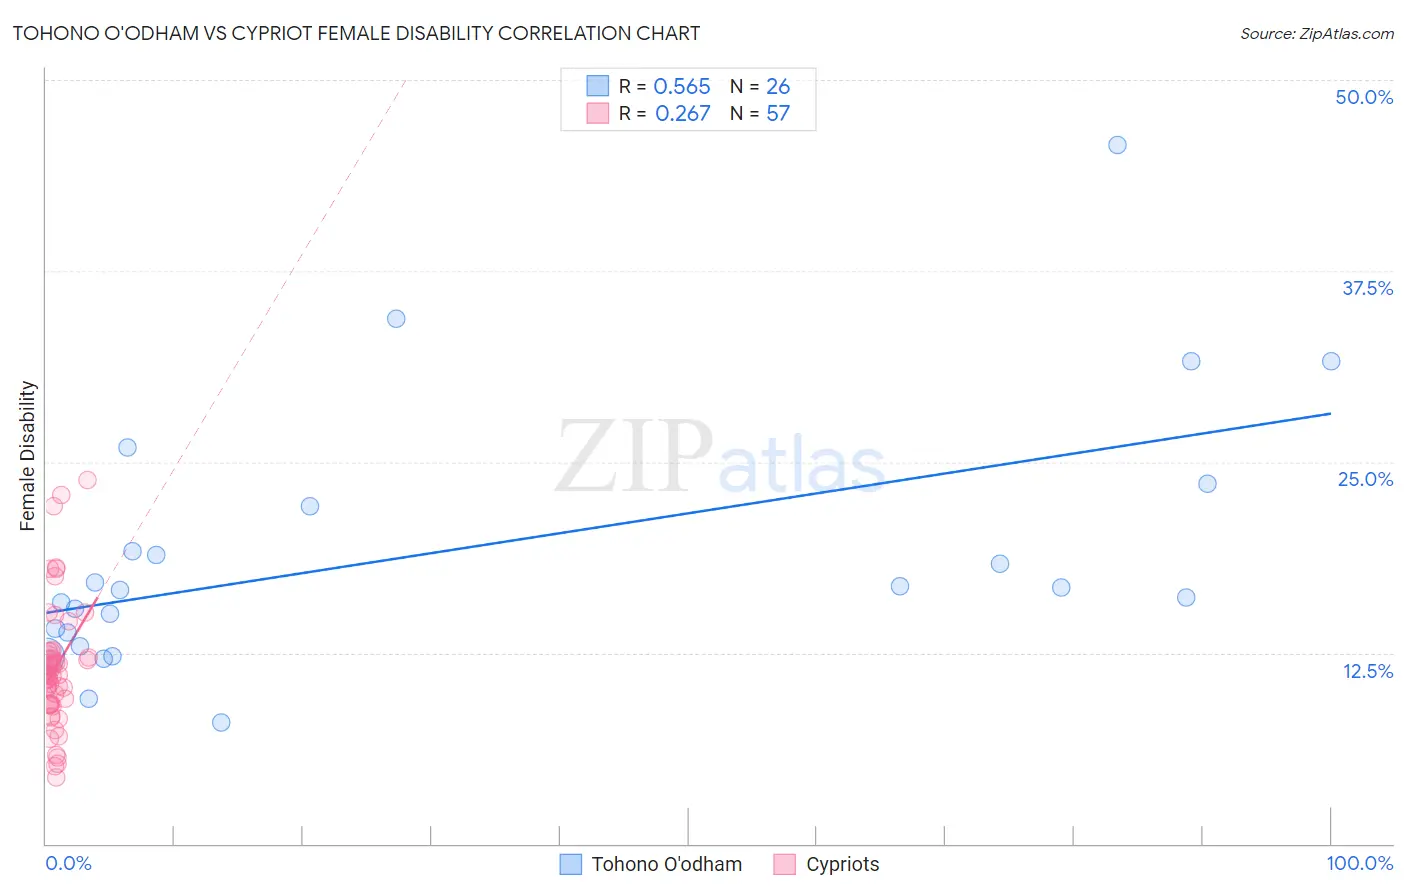
Tohono O'odham vs Cypriot Female Disability Correlation Chart
The statistical analysis conducted on geographies consisting of 58,717,428 people shows a substantial positive correlation between the proportion of Tohono O'odham and percentage of females with a disability in the United States with a correlation coefficient (R) of 0.565 and weighted average of 15.0%. Similarly, the statistical analysis conducted on geographies consisting of 61,870,589 people shows a weak positive correlation between the proportion of Cypriots and percentage of females with a disability in the United States with a correlation coefficient (R) of 0.267 and weighted average of 11.2%, a difference of 33.9%.
Female Disability Correlation Summary
| Measurement | Tohono O'odham | Cypriot |
| Minimum | 8.0% | 4.4% |
| Maximum | 45.8% | 23.8% |
| Range | 37.8% | 19.4% |
| Mean | 19.1% | 11.5% |
| Median | 16.7% | 11.1% |
| Interquartile 25% (IQ1) | 13.9% | 9.1% |
| Interquartile 75% (IQ3) | 22.1% | 12.4% |
| Interquartile Range (IQR) | 8.3% | 3.3% |
| Standard Deviation (Sample) | 8.6% | 4.1% |
| Standard Deviation (Population) | 8.4% | 4.1% |
Similar Demographics by Female Disability
Demographics Similar to Tohono O'odham by Female Disability
In terms of female disability, the demographic groups most similar to Tohono O'odham are Seminole (15.0%, a difference of 0.12%), Dutch West Indian (15.0%, a difference of 0.14%), Colville (15.1%, a difference of 0.55%), Cajun (14.9%, a difference of 0.80%), and Cherokee (14.9%, a difference of 0.82%).
| Demographics | Rating | Rank | Female Disability |
| Yuman | 0.0 /100 | #330 | Tragic 14.5% |
| Immigrants | Cabo Verde | 0.0 /100 | #331 | Tragic 14.6% |
| Pima | 0.0 /100 | #332 | Tragic 14.8% |
| Immigrants | Azores | 0.0 /100 | #333 | Tragic 14.9% |
| Cherokee | 0.0 /100 | #334 | Tragic 14.9% |
| Cajuns | 0.0 /100 | #335 | Tragic 14.9% |
| Seminole | 0.0 /100 | #336 | Tragic 15.0% |
| Tohono O'odham | 0.0 /100 | #337 | Tragic 15.0% |
| Dutch West Indians | 0.0 /100 | #338 | Tragic 15.0% |
| Colville | 0.0 /100 | #339 | Tragic 15.1% |
| Chickasaw | 0.0 /100 | #340 | Tragic 15.2% |
| Choctaw | 0.0 /100 | #341 | Tragic 15.4% |
| Creek | 0.0 /100 | #342 | Tragic 15.7% |
| Lumbee | 0.0 /100 | #343 | Tragic 15.8% |
| Kiowa | 0.0 /100 | #344 | Tragic 15.8% |
Demographics Similar to Cypriots by Female Disability
In terms of female disability, the demographic groups most similar to Cypriots are Ethiopian (11.2%, a difference of 0.010%), Immigrants from Ethiopia (11.2%, a difference of 0.040%), Immigrants from Japan (11.2%, a difference of 0.070%), Immigrants from Indonesia (11.2%, a difference of 0.21%), and Immigrants from Lithuania (11.2%, a difference of 0.25%).
| Demographics | Rating | Rank | Female Disability |
| Immigrants | Malaysia | 100.0 /100 | #29 | Exceptional 11.1% |
| Turks | 100.0 /100 | #30 | Exceptional 11.1% |
| Immigrants | Kuwait | 100.0 /100 | #31 | Exceptional 11.1% |
| Immigrants | Australia | 100.0 /100 | #32 | Exceptional 11.1% |
| Immigrants | Egypt | 100.0 /100 | #33 | Exceptional 11.1% |
| Immigrants | Indonesia | 100.0 /100 | #34 | Exceptional 11.2% |
| Immigrants | Japan | 100.0 /100 | #35 | Exceptional 11.2% |
| Cypriots | 100.0 /100 | #36 | Exceptional 11.2% |
| Ethiopians | 100.0 /100 | #37 | Exceptional 11.2% |
| Immigrants | Ethiopia | 100.0 /100 | #38 | Exceptional 11.2% |
| Immigrants | Lithuania | 100.0 /100 | #39 | Exceptional 11.2% |
| Mongolians | 100.0 /100 | #40 | Exceptional 11.2% |
| Paraguayans | 100.0 /100 | #41 | Exceptional 11.2% |
| Israelis | 100.0 /100 | #42 | Exceptional 11.2% |
| Afghans | 100.0 /100 | #43 | Exceptional 11.2% |