Slovak vs Immigrants from Congo Male Disability
COMPARE
Slovak
Immigrants from Congo
Male Disability
Male Disability Comparison
Slovaks
Immigrants from Congo
12.7%
MALE DISABILITY
0.0/ 100
METRIC RATING
279th/ 347
METRIC RANK
11.7%
MALE DISABILITY
3.7/ 100
METRIC RATING
221st/ 347
METRIC RANK
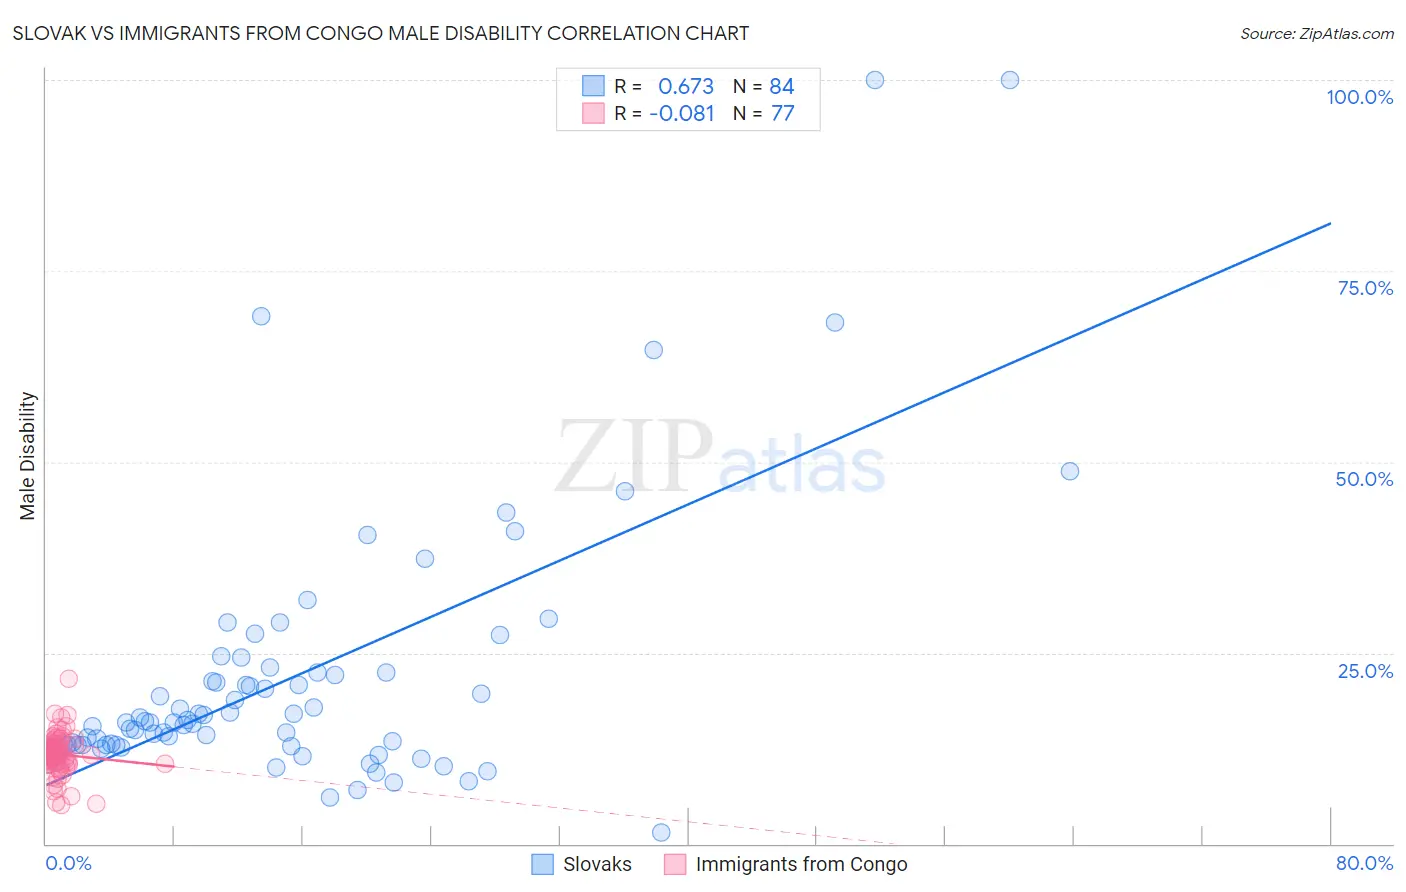
Slovak vs Immigrants from Congo Male Disability Correlation Chart
The statistical analysis conducted on geographies consisting of 397,843,649 people shows a significant positive correlation between the proportion of Slovaks and percentage of males with a disability in the United States with a correlation coefficient (R) of 0.673 and weighted average of 12.7%. Similarly, the statistical analysis conducted on geographies consisting of 92,121,223 people shows a slight negative correlation between the proportion of Immigrants from Congo and percentage of males with a disability in the United States with a correlation coefficient (R) of -0.081 and weighted average of 11.7%, a difference of 8.3%.
Male Disability Correlation Summary
| Measurement | Slovak | Immigrants from Congo |
| Minimum | 1.5% | 5.1% |
| Maximum | 100.0% | 21.7% |
| Range | 98.5% | 16.5% |
| Mean | 21.9% | 11.7% |
| Median | 15.9% | 11.8% |
| Interquartile 25% (IQ1) | 12.9% | 10.6% |
| Interquartile 75% (IQ3) | 22.4% | 12.9% |
| Interquartile Range (IQR) | 9.5% | 2.4% |
| Standard Deviation (Sample) | 17.7% | 2.7% |
| Standard Deviation (Population) | 17.6% | 2.6% |
Similar Demographics by Male Disability
Demographics Similar to Slovaks by Male Disability
In terms of male disability, the demographic groups most similar to Slovaks are Dutch (12.7%, a difference of 0.050%), Sioux (12.7%, a difference of 0.11%), Central American Indian (12.7%, a difference of 0.15%), Irish (12.7%, a difference of 0.16%), and German (12.7%, a difference of 0.17%).
| Demographics | Rating | Rank | Male Disability |
| Hmong | 0.0 /100 | #272 | Tragic 12.5% |
| Native Hawaiians | 0.0 /100 | #273 | Tragic 12.5% |
| Hopi | 0.0 /100 | #274 | Tragic 12.5% |
| Fijians | 0.0 /100 | #275 | Tragic 12.6% |
| Africans | 0.0 /100 | #276 | Tragic 12.6% |
| Finns | 0.0 /100 | #277 | Tragic 12.6% |
| Central American Indians | 0.0 /100 | #278 | Tragic 12.7% |
| Slovaks | 0.0 /100 | #279 | Tragic 12.7% |
| Dutch | 0.0 /100 | #280 | Tragic 12.7% |
| Sioux | 0.0 /100 | #281 | Tragic 12.7% |
| Irish | 0.0 /100 | #282 | Tragic 12.7% |
| Germans | 0.0 /100 | #283 | Tragic 12.7% |
| Spanish | 0.0 /100 | #284 | Tragic 12.7% |
| Welsh | 0.0 /100 | #285 | Tragic 12.7% |
| Scottish | 0.0 /100 | #286 | Tragic 12.8% |
Demographics Similar to Immigrants from Congo by Male Disability
In terms of male disability, the demographic groups most similar to Immigrants from Congo are Immigrants from Western Europe (11.7%, a difference of 0.010%), Panamanian (11.7%, a difference of 0.020%), Immigrants from England (11.7%, a difference of 0.080%), Alsatian (11.7%, a difference of 0.15%), and Immigrants from Bahamas (11.7%, a difference of 0.24%).
| Demographics | Rating | Rank | Male Disability |
| Lithuanians | 6.6 /100 | #214 | Tragic 11.6% |
| Indonesians | 5.9 /100 | #215 | Tragic 11.6% |
| Immigrants | Dominican Republic | 4.9 /100 | #216 | Tragic 11.7% |
| Immigrants | Dominica | 4.6 /100 | #217 | Tragic 11.7% |
| Immigrants | England | 4.0 /100 | #218 | Tragic 11.7% |
| Panamanians | 3.8 /100 | #219 | Tragic 11.7% |
| Immigrants | Western Europe | 3.8 /100 | #220 | Tragic 11.7% |
| Immigrants | Congo | 3.7 /100 | #221 | Tragic 11.7% |
| Alsatians | 3.3 /100 | #222 | Tragic 11.7% |
| Immigrants | Bahamas | 3.2 /100 | #223 | Tragic 11.7% |
| Japanese | 3.1 /100 | #224 | Tragic 11.7% |
| Liberians | 3.1 /100 | #225 | Tragic 11.8% |
| Sub-Saharan Africans | 2.8 /100 | #226 | Tragic 11.8% |
| Austrians | 2.5 /100 | #227 | Tragic 11.8% |
| Hispanics or Latinos | 2.3 /100 | #228 | Tragic 11.8% |