Immigrants from Nicaragua vs Immigrants from Congo Male Disability

COMPARE

Immigrants from Nicaragua
Race
Ancestry
AfghanAfricanAlaska NativeAlaskan AthabascanAlbanianAleutAlsatianAmericanApacheArabArapahoArgentineanArmenianAssyrian/Chaldean/SyriacAustralianAustrianBahamianBangladeshiBarbadianBasqueBelgianBelizeanBermudanBhutaneseBlackfeetBolivianBrazilianBritishBritish West IndianBulgarianBurmeseCajunCambodianCanadianCape VerdeanCarpatho RusynCelticCentral AmericanCentral American IndianCherokeeCheyenneChickasawChileanChineseChippewaChoctawColombianColvilleComancheCosta RicanCreeCreekCroatianCrowCubanCypriotCzechCzechoslovakianDanishDelawareDominicanDutchDutch West IndianEastern EuropeanEcuadorianEgyptianEnglishEstonianEthiopianEuropeanFijianFilipinoFinnishFrenchFrench American IndianFrench CanadianGermanGerman RussianGhanaianGreekGuamanian/ChamorroGuatemalanGuyaneseHaitianHmongHonduranHopiHoumaHungarianIcelanderIndian (Asian)IndonesianInupiatIranianIraqiIrishIroquoisIsraeliItalianJamaicanJapaneseJordanianKenyanKiowaKoreanLaotianLatvianLebaneseLiberianLithuanianLumbeeLuxembourgerMacedonianMalaysianMalteseMarshalleseMenomineeMexicanMexican American IndianMongolianMoroccanNative HawaiianNavajoNepaleseNew ZealanderNicaraguanNigerianNorthern EuropeanNorwegianOkinawanOsageOttawaPaiutePakistaniPalestinianPanamanianParaguayanPennsylvania GermanPeruvianPimaPolishPortuguesePotawatomiPuebloPuerto RicanPuget Sound SalishRomanianRussianSalvadoranSamoanScandinavianScotch-IrishScottishSeminoleSenegaleseSerbianShoshoneSierra LeoneanSiouxSlavicSlovakSloveneSomaliSouth AfricanSouth AmericanSouth American IndianSoviet UnionSpaniardSpanishSpanish AmericanSpanish American IndianSri LankanSubsaharan AfricanSudaneseSwedishSwissSyrianTaiwaneseThaiTlingit-HaidaTohono O'OdhamTonganTrinidadian and TobagonianTsimshianTurkishU.S. Virgin IslanderUgandanUkrainianUruguayanUteVenezuelanVietnameseWelshWest IndianYakamaYaquiYugoslavianYumanYup'ikZimbabwean
Immigration
NonimmigrantsImmigrantsAfghanistanAfricaAlbaniaArgentinaArmeniaAsiaAustraliaAustriaBahamasBangladeshBarbadosBelarusBelgiumBelizeBoliviaBosnia and HerzegovinaBrazilBulgariaBurma/MyanmarCabo VerdeCambodiaCameroonCanadaCaribbeanCentral AmericaChileChinaColombiaCosta RicaCroatiaCubaCzechoslovakiaDenmarkDominicaDominican RepublicEastern AfricaEastern AsiaEastern EuropeEcuadorEgyptEl SalvadorEnglandEritreaEthiopiaEuropeFijiFranceGermanyGhanaGreeceGrenadaGuatemalaGuyanaHaitiHondurasHong KongHungaryIndiaIndonesiaIranIraqIrelandIsraelItalyJamaicaJapanJordanKazakhstanKenyaKoreaKuwaitLaosLatin AmericaLatviaLebanonLiberiaLithuaniaMalaysiaMexicoMicronesiaMiddle AfricaMoldovaMoroccoNepalNetherlandsNicaraguaNigeriaNorth AmericaNorth MacedoniaNorthern AfricaNorthern EuropeNorwayOceaniaPakistanPanamaPeruPhilippinesPolandPortugalRomaniaRussiaSaudi ArabiaScotlandSenegalSerbiaSierra LeoneSingaporeSomaliaSouth AfricaSouth AmericaSouth Central AsiaSouth Eastern AsiaSouthern EuropeSpainSri LankaSt. Vincent and the GrenadinesSudanSwedenSwitzerlandSyriaTaiwanThailandTrinidad and TobagoTurkeyUgandaUkraineUruguayUzbekistanVenezuelaVietnamWest IndiesWestern AfricaWestern AsiaWestern EuropeYemenZaireZimbabweAzores
Immigrants from Congo
Race
Ancestry
AfghanAfricanAlaska NativeAlaskan AthabascanAlbanianAleutAlsatianAmericanApacheArabArapahoArgentineanArmenianAssyrian/Chaldean/SyriacAustralianAustrianBahamianBangladeshiBarbadianBasqueBelgianBelizeanBermudanBhutaneseBlackfeetBolivianBrazilianBritishBritish West IndianBulgarianBurmeseCajunCambodianCanadianCape VerdeanCarpatho RusynCelticCentral AmericanCentral American IndianCherokeeCheyenneChickasawChileanChineseChippewaChoctawColombianColvilleComancheCosta RicanCreeCreekCroatianCrowCubanCypriotCzechCzechoslovakianDanishDelawareDominicanDutchDutch West IndianEastern EuropeanEcuadorianEgyptianEnglishEstonianEthiopianEuropeanFijianFilipinoFinnishFrenchFrench American IndianFrench CanadianGermanGerman RussianGhanaianGreekGuamanian/ChamorroGuatemalanGuyaneseHaitianHmongHonduranHopiHoumaHungarianIcelanderIndian (Asian)IndonesianInupiatIranianIraqiIrishIroquoisIsraeliItalianJamaicanJapaneseJordanianKenyanKiowaKoreanLaotianLatvianLebaneseLiberianLithuanianLumbeeLuxembourgerMacedonianMalaysianMalteseMarshalleseMenomineeMexicanMexican American IndianMongolianMoroccanNative HawaiianNavajoNepaleseNew ZealanderNicaraguanNigerianNorthern EuropeanNorwegianOkinawanOsageOttawaPaiutePakistaniPalestinianPanamanianParaguayanPennsylvania GermanPeruvianPimaPolishPortuguesePotawatomiPuebloPuerto RicanPuget Sound SalishRomanianRussianSalvadoranSamoanScandinavianScotch-IrishScottishSeminoleSenegaleseSerbianShoshoneSierra LeoneanSiouxSlavicSlovakSloveneSomaliSouth AfricanSouth AmericanSouth American IndianSoviet UnionSpaniardSpanishSpanish AmericanSpanish American IndianSri LankanSubsaharan AfricanSudaneseSwedishSwissSyrianTaiwaneseThaiTlingit-HaidaTohono O'OdhamTonganTrinidadian and TobagonianTsimshianTurkishU.S. Virgin IslanderUgandanUkrainianUruguayanUteVenezuelanVietnameseWelshWest IndianYakamaYaquiYugoslavianYumanYup'ikZimbabwean
Immigration
NonimmigrantsImmigrantsAfghanistanAfricaAlbaniaArgentinaArmeniaAsiaAustraliaAustriaBahamasBangladeshBarbadosBelarusBelgiumBelizeBoliviaBosnia and HerzegovinaBrazilBulgariaBurma/MyanmarCabo VerdeCambodiaCameroonCanadaCaribbeanCentral AmericaChileChinaColombiaCongoCosta RicaCroatiaCubaCzechoslovakiaDenmarkDominicaDominican RepublicEastern AfricaEastern AsiaEastern EuropeEcuadorEgyptEl SalvadorEnglandEritreaEthiopiaEuropeFijiFranceGermanyGhanaGreeceGrenadaGuatemalaGuyanaHaitiHondurasHong KongHungaryIndiaIndonesiaIranIraqIrelandIsraelItalyJamaicaJapanJordanKazakhstanKenyaKoreaKuwaitLaosLatin AmericaLatviaLebanonLiberiaLithuaniaMalaysiaMexicoMicronesiaMiddle AfricaMoldovaMoroccoNepalNetherlandsNigeriaNorth AmericaNorth MacedoniaNorthern AfricaNorthern EuropeNorwayOceaniaPakistanPanamaPeruPhilippinesPolandPortugalRomaniaRussiaSaudi ArabiaScotlandSenegalSerbiaSierra LeoneSingaporeSomaliaSouth AfricaSouth AmericaSouth Central AsiaSouth Eastern AsiaSouthern EuropeSpainSri LankaSt. Vincent and the GrenadinesSudanSwedenSwitzerlandSyriaTaiwanThailandTrinidad and TobagoTurkeyUgandaUkraineUruguayUzbekistanVenezuelaVietnamWest IndiesWestern AfricaWestern AsiaWestern EuropeYemenZaireZimbabweAzores
Male Disability
Income
Poverty
Unemployment
Labor Participation
Family Structure
Vehicle Availability
Education Level
Disability

Male Disability Comparison

Immigrants from Nicaragua

Immigrants from Congo

Exceptional
Tragic
10.6%
MALE DISABILITY
97.8/ 100
METRIC RATING
89th/ 347
METRIC RANK
11.7%
MALE DISABILITY
3.7/ 100
METRIC RATING
221st/ 347
METRIC RANK

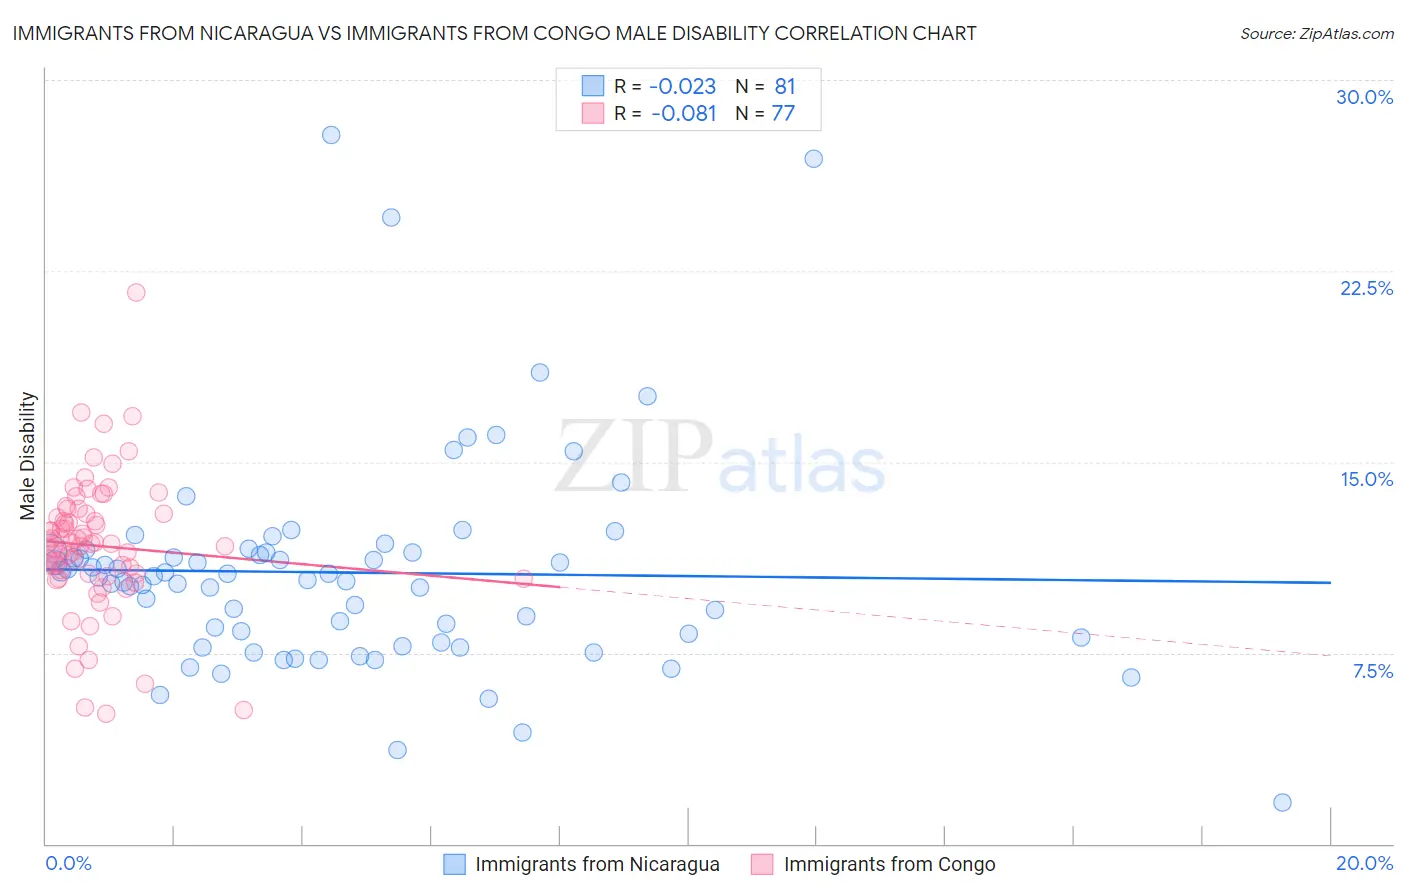
Immigrants from Nicaragua vs Immigrants from Congo Male Disability Correlation Chart

The statistical analysis conducted on geographies consisting of 236,327,634 people shows no correlation between the proportion of Immigrants from Nicaragua and percentage of males with a disability in the United States with a correlation coefficient (R) of -0.023 and weighted average of 10.6%. Similarly, the statistical analysis conducted on geographies consisting of 92,121,223 people shows a slight negative correlation between the proportion of Immigrants from Congo and percentage of males with a disability in the United States with a correlation coefficient (R) of -0.081 and weighted average of 11.7%, a difference of 10.2%.
Immigrants from Nicaragua vs Immigrants from Congo Male Disability

Male Disability Correlation Summary

MeasurementImmigrants from NicaraguaImmigrants from Congo
Minimum1.6%5.1%
Maximum27.8%21.7%
Range26.2%16.5%
Mean10.7%11.7%
Median10.5%11.8%
Interquartile 25% (IQ1)8.0%10.6%
Interquartile 75% (IQ3)11.4%12.9%
Interquartile Range (IQR)3.5%2.4%
Standard Deviation (Sample)4.2%2.7%
Standard Deviation (Population)4.2%2.6%

Similar Demographics by Male Disability

Demographics Similar to Immigrants from Nicaragua by Male Disability

In terms of male disability, the demographic groups most similar to Immigrants from Nicaragua are Immigrants from Western Asia (10.6%, a difference of 0.0%), Immigrants from Morocco (10.6%, a difference of 0.050%), Immigrants from Vietnam (10.6%, a difference of 0.070%), Immigrants from Ireland (10.6%, a difference of 0.090%), and Immigrants from France (10.6%, a difference of 0.090%).
DemographicsRating | RankMale Disability
Immigrants | Guyana
98.2
/100
|
#82
Exceptional
10.6%
Immigrants | Poland
98.1
/100
|
#83
Exceptional
10.6%
Bulgarians
98.1
/100
|
#84
Exceptional
10.6%
Sri Lankans
97.9
/100
|
#85
Exceptional
10.6%
Immigrants | Ireland
97.9
/100
|
#86
Exceptional
10.6%
Immigrants | Vietnam
97.9
/100
|
#87
Exceptional
10.6%
Immigrants | Western Asia
97.8
/100
|
#88
Exceptional
10.6%
Immigrants | Nicaragua
97.8
/100
|
#89
Exceptional
10.6%
Immigrants | Morocco
97.7
/100
|
#90
Exceptional
10.6%
Immigrants | France
97.6
/100
|
#91
Exceptional
10.6%
Palestinians
97.4
/100
|
#92
Exceptional
10.7%
Immigrants | St. Vincent and the Grenadines
97.1
/100
|
#93
Exceptional
10.7%
Immigrants | Sweden
96.9
/100
|
#94
Exceptional
10.7%
Chileans
96.9
/100
|
#95
Exceptional
10.7%
Nicaraguans
96.6
/100
|
#96
Exceptional
10.7%

Demographics Similar to Immigrants from Congo by Male Disability

In terms of male disability, the demographic groups most similar to Immigrants from Congo are Immigrants from Western Europe (11.7%, a difference of 0.010%), Panamanian (11.7%, a difference of 0.020%), Immigrants from England (11.7%, a difference of 0.080%), Alsatian (11.7%, a difference of 0.15%), and Immigrants from Bahamas (11.7%, a difference of 0.24%).
DemographicsRating | RankMale Disability
Lithuanians
6.6
/100
|
#214
Tragic
11.6%
Indonesians
5.9
/100
|
#215
Tragic
11.6%
Immigrants | Dominican Republic
4.9
/100
|
#216
Tragic
11.7%
Immigrants | Dominica
4.6
/100
|
#217
Tragic
11.7%
Immigrants | England
4.0
/100
|
#218
Tragic
11.7%
Panamanians
3.8
/100
|
#219
Tragic
11.7%
Immigrants | Western Europe
3.8
/100
|
#220
Tragic
11.7%
Immigrants | Congo
3.7
/100
|
#221
Tragic
11.7%
Alsatians
3.3
/100
|
#222
Tragic
11.7%
Immigrants | Bahamas
3.2
/100
|
#223
Tragic
11.7%
Japanese
3.1
/100
|
#224
Tragic
11.7%
Liberians
3.1
/100
|
#225
Tragic
11.8%
Sub-Saharan Africans
2.8
/100
|
#226
Tragic
11.8%
Austrians
2.5
/100
|
#227
Tragic
11.8%
Hispanics or Latinos
2.3
/100
|
#228
Tragic
11.8%