Sierra Leonean vs Nonimmigrants Male Disability
COMPARE
Sierra Leonean
Nonimmigrants
Male Disability
Male Disability Comparison
Sierra Leoneans
Nonimmigrants
10.5%
MALE DISABILITY
98.7/ 100
METRIC RATING
75th/ 347
METRIC RANK
12.9%
MALE DISABILITY
0.0/ 100
METRIC RATING
296th/ 347
METRIC RANK
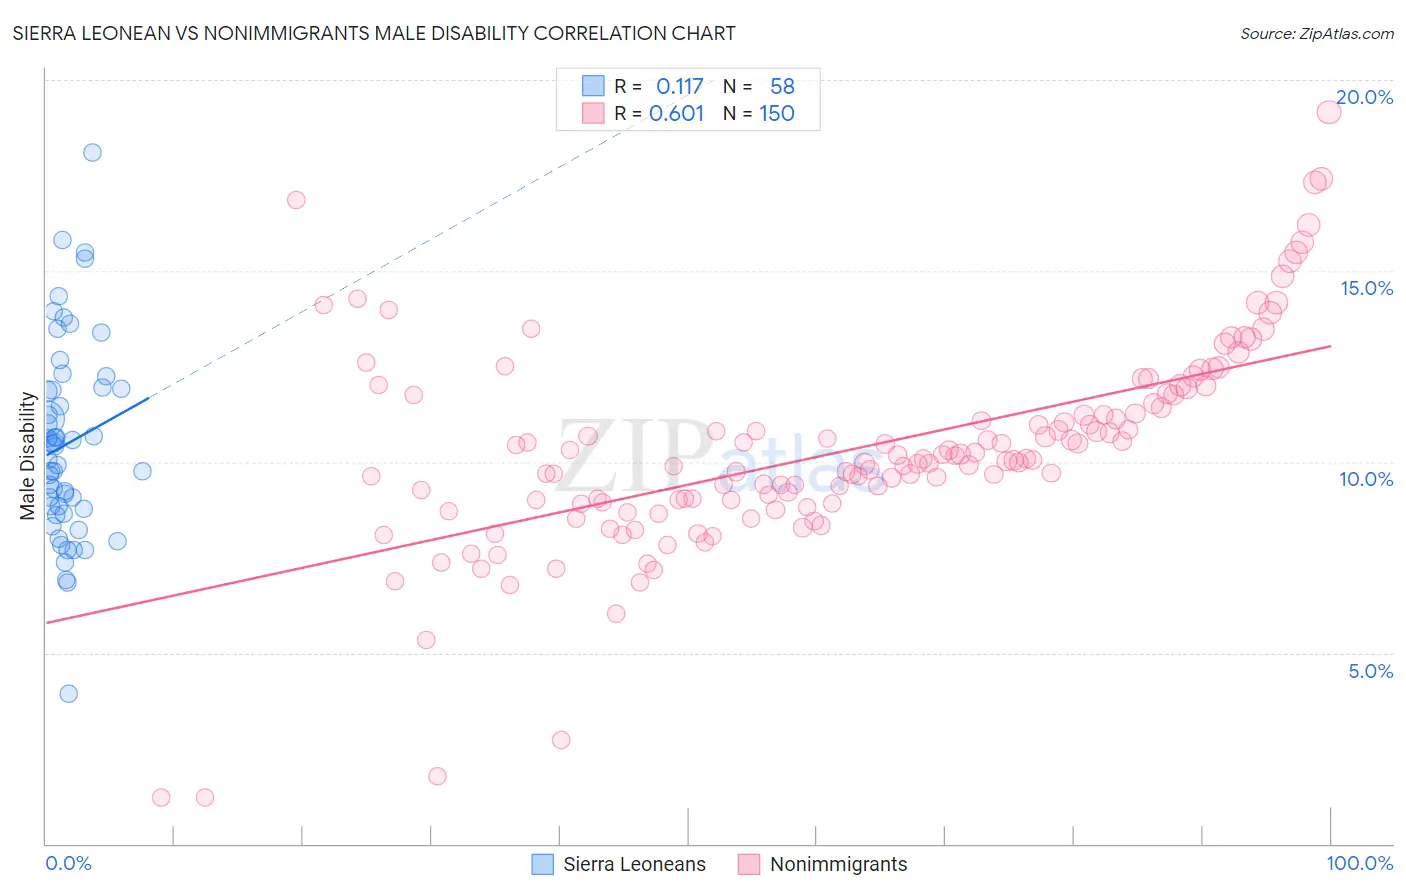
Sierra Leonean vs Nonimmigrants Male Disability Correlation Chart
The statistical analysis conducted on geographies consisting of 83,361,010 people shows a poor positive correlation between the proportion of Sierra Leoneans and percentage of males with a disability in the United States with a correlation coefficient (R) of 0.117 and weighted average of 10.5%. Similarly, the statistical analysis conducted on geographies consisting of 584,663,642 people shows a significant positive correlation between the proportion of Nonimmigrants and percentage of males with a disability in the United States with a correlation coefficient (R) of 0.601 and weighted average of 12.9%, a difference of 22.7%.
Male Disability Correlation Summary
| Measurement | Sierra Leonean | Nonimmigrants |
| Minimum | 3.9% | 1.2% |
| Maximum | 18.1% | 19.2% |
| Range | 14.2% | 18.0% |
| Mean | 10.5% | 10.3% |
| Median | 10.2% | 10.0% |
| Interquartile 25% (IQ1) | 8.8% | 8.9% |
| Interquartile 75% (IQ3) | 11.9% | 11.5% |
| Interquartile Range (IQR) | 3.2% | 2.6% |
| Standard Deviation (Sample) | 2.6% | 2.7% |
| Standard Deviation (Population) | 2.6% | 2.7% |
Similar Demographics by Male Disability
Demographics Similar to Sierra Leoneans by Male Disability
In terms of male disability, the demographic groups most similar to Sierra Leoneans are Immigrants from Sierra Leone (10.5%, a difference of 0.040%), Laotian (10.6%, a difference of 0.10%), Immigrants from Lebanon (10.5%, a difference of 0.12%), Immigrants from Russia (10.6%, a difference of 0.12%), and Immigrants from Lithuania (10.5%, a difference of 0.26%).
| Demographics | Rating | Rank | Male Disability |
| Colombians | 99.2 /100 | #68 | Exceptional 10.5% |
| Ecuadorians | 99.2 /100 | #69 | Exceptional 10.5% |
| Immigrants | Bulgaria | 99.1 /100 | #70 | Exceptional 10.5% |
| Immigrants | Cameroon | 99.0 /100 | #71 | Exceptional 10.5% |
| Immigrants | Serbia | 99.0 /100 | #72 | Exceptional 10.5% |
| Immigrants | Lithuania | 98.9 /100 | #73 | Exceptional 10.5% |
| Immigrants | Lebanon | 98.8 /100 | #74 | Exceptional 10.5% |
| Sierra Leoneans | 98.7 /100 | #75 | Exceptional 10.5% |
| Immigrants | Sierra Leone | 98.7 /100 | #76 | Exceptional 10.5% |
| Laotians | 98.6 /100 | #77 | Exceptional 10.6% |
| Immigrants | Russia | 98.6 /100 | #78 | Exceptional 10.6% |
| Zimbabweans | 98.4 /100 | #79 | Exceptional 10.6% |
| Immigrants | Jordan | 98.4 /100 | #80 | Exceptional 10.6% |
| Immigrants | Chile | 98.3 /100 | #81 | Exceptional 10.6% |
| Immigrants | Guyana | 98.2 /100 | #82 | Exceptional 10.6% |
Demographics Similar to Nonimmigrants by Male Disability
In terms of male disability, the demographic groups most similar to Nonimmigrants are Immigrants from Micronesia (12.9%, a difference of 0.070%), Inupiat (13.0%, a difference of 0.11%), Marshallese (12.9%, a difference of 0.16%), Pennsylvania German (13.0%, a difference of 0.31%), and Yaqui (12.9%, a difference of 0.40%).
| Demographics | Rating | Rank | Male Disability |
| Immigrants | Cabo Verde | 0.0 /100 | #289 | Tragic 12.8% |
| Pima | 0.0 /100 | #290 | Tragic 12.8% |
| Whites/Caucasians | 0.0 /100 | #291 | Tragic 12.8% |
| English | 0.0 /100 | #292 | Tragic 12.8% |
| Yaqui | 0.0 /100 | #293 | Tragic 12.9% |
| Marshallese | 0.0 /100 | #294 | Tragic 12.9% |
| Immigrants | Micronesia | 0.0 /100 | #295 | Tragic 12.9% |
| Immigrants | Nonimmigrants | 0.0 /100 | #296 | Tragic 12.9% |
| Inupiat | 0.0 /100 | #297 | Tragic 13.0% |
| Pennsylvania Germans | 0.0 /100 | #298 | Tragic 13.0% |
| Celtics | 0.0 /100 | #299 | Tragic 13.0% |
| Cheyenne | 0.0 /100 | #300 | Tragic 13.0% |
| French | 0.0 /100 | #301 | Tragic 13.0% |
| Crow | 0.0 /100 | #302 | Tragic 13.1% |
| Scotch-Irish | 0.0 /100 | #303 | Tragic 13.2% |