Salvadoran vs Immigrants from Haiti Male Disability
COMPARE
Salvadoran
Immigrants from Haiti
Male Disability
Male Disability Comparison
Salvadorans
Immigrants from Haiti
10.4%
MALE DISABILITY
99.6/ 100
METRIC RATING
51st/ 347
METRIC RANK
11.1%
MALE DISABILITY
65.3/ 100
METRIC RATING
162nd/ 347
METRIC RANK
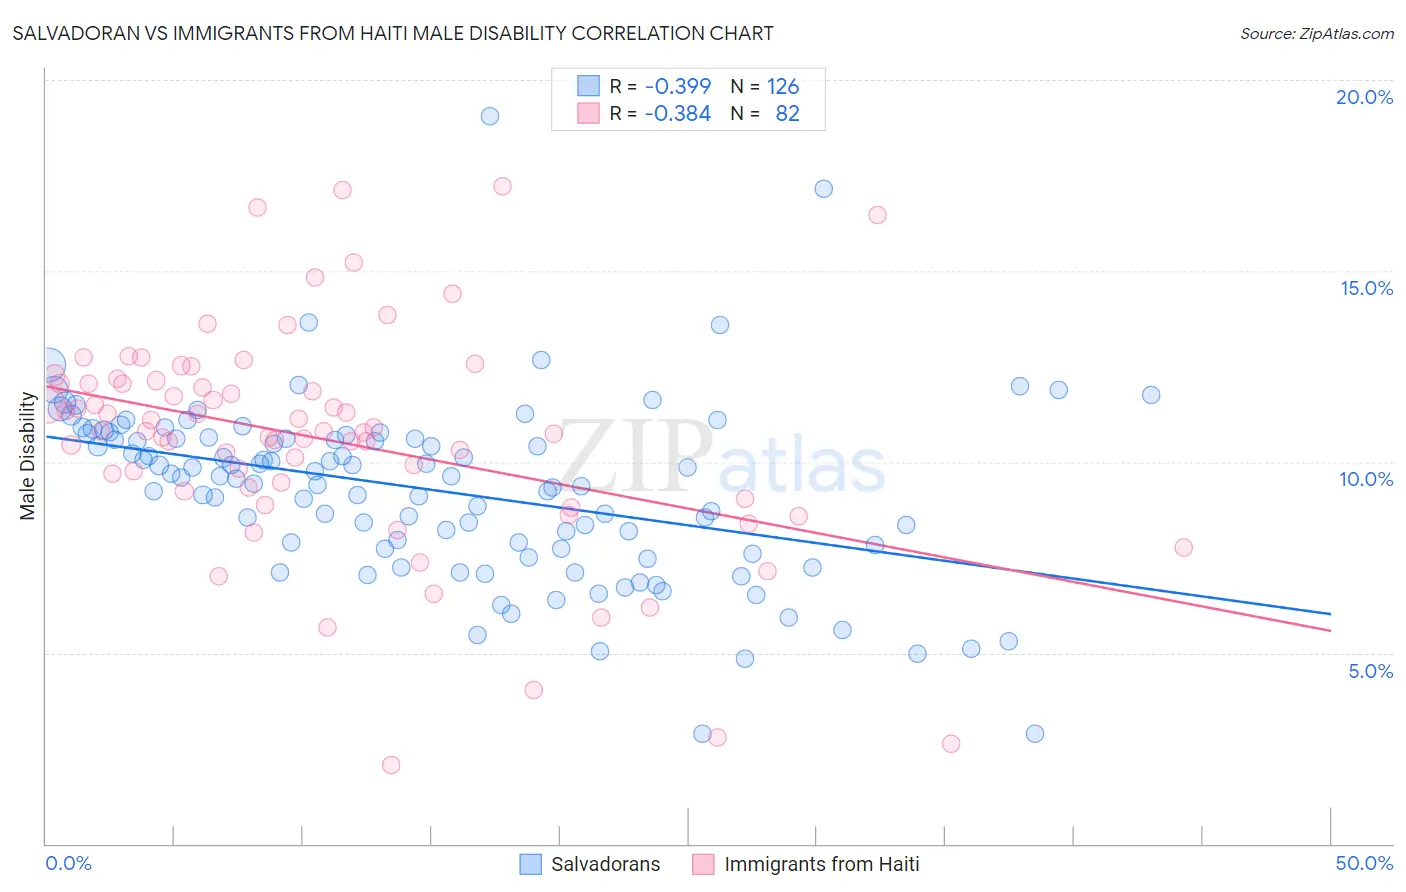
Salvadoran vs Immigrants from Haiti Male Disability Correlation Chart
The statistical analysis conducted on geographies consisting of 398,921,058 people shows a mild negative correlation between the proportion of Salvadorans and percentage of males with a disability in the United States with a correlation coefficient (R) of -0.399 and weighted average of 10.4%. Similarly, the statistical analysis conducted on geographies consisting of 225,231,442 people shows a mild negative correlation between the proportion of Immigrants from Haiti and percentage of males with a disability in the United States with a correlation coefficient (R) of -0.384 and weighted average of 11.1%, a difference of 7.3%.
Male Disability Correlation Summary
| Measurement | Salvadoran | Immigrants from Haiti |
| Minimum | 2.9% | 2.1% |
| Maximum | 19.1% | 17.2% |
| Range | 16.2% | 15.1% |
| Mean | 9.3% | 10.6% |
| Median | 9.6% | 10.8% |
| Interquartile 25% (IQ1) | 7.7% | 9.2% |
| Interquartile 75% (IQ3) | 10.6% | 12.1% |
| Interquartile Range (IQR) | 2.9% | 2.8% |
| Standard Deviation (Sample) | 2.4% | 2.9% |
| Standard Deviation (Population) | 2.3% | 2.9% |
Similar Demographics by Male Disability
Demographics Similar to Salvadorans by Male Disability
In terms of male disability, the demographic groups most similar to Salvadorans are Immigrants from Saudi Arabia (10.4%, a difference of 0.020%), Immigrants from Uzbekistan (10.4%, a difference of 0.040%), Peruvian (10.4%, a difference of 0.080%), Immigrants from Eritrea (10.4%, a difference of 0.10%), and Tongan (10.4%, a difference of 0.14%).
| Demographics | Rating | Rank | Male Disability |
| Immigrants | El Salvador | 99.7 /100 | #44 | Exceptional 10.3% |
| Turks | 99.7 /100 | #45 | Exceptional 10.3% |
| Cambodians | 99.7 /100 | #46 | Exceptional 10.3% |
| Immigrants | Peru | 99.7 /100 | #47 | Exceptional 10.3% |
| Israelis | 99.7 /100 | #48 | Exceptional 10.3% |
| Immigrants | Spain | 99.7 /100 | #49 | Exceptional 10.3% |
| South Americans | 99.6 /100 | #50 | Exceptional 10.3% |
| Salvadorans | 99.6 /100 | #51 | Exceptional 10.4% |
| Immigrants | Saudi Arabia | 99.6 /100 | #52 | Exceptional 10.4% |
| Immigrants | Uzbekistan | 99.6 /100 | #53 | Exceptional 10.4% |
| Peruvians | 99.6 /100 | #54 | Exceptional 10.4% |
| Immigrants | Eritrea | 99.6 /100 | #55 | Exceptional 10.4% |
| Tongans | 99.6 /100 | #56 | Exceptional 10.4% |
| Immigrants | South America | 99.6 /100 | #57 | Exceptional 10.4% |
| Immigrants | Japan | 99.5 /100 | #58 | Exceptional 10.4% |
Demographics Similar to Immigrants from Haiti by Male Disability
In terms of male disability, the demographic groups most similar to Immigrants from Haiti are Immigrants from West Indies (11.1%, a difference of 0.020%), Albanian (11.1%, a difference of 0.070%), Immigrants from Kenya (11.1%, a difference of 0.090%), Guatemalan (11.1%, a difference of 0.12%), and British West Indian (11.1%, a difference of 0.15%).
| Demographics | Rating | Rank | Male Disability |
| Immigrants | Middle Africa | 70.9 /100 | #155 | Good 11.1% |
| Russians | 69.8 /100 | #156 | Good 11.1% |
| Immigrants | Western Africa | 69.2 /100 | #157 | Good 11.1% |
| Latvians | 68.1 /100 | #158 | Good 11.1% |
| Guatemalans | 67.2 /100 | #159 | Good 11.1% |
| Albanians | 66.5 /100 | #160 | Good 11.1% |
| Immigrants | West Indies | 65.7 /100 | #161 | Good 11.1% |
| Immigrants | Haiti | 65.3 /100 | #162 | Good 11.1% |
| Immigrants | Kenya | 63.8 /100 | #163 | Good 11.1% |
| British West Indians | 62.8 /100 | #164 | Good 11.1% |
| Luxembourgers | 61.9 /100 | #165 | Good 11.1% |
| Immigrants | Hungary | 61.2 /100 | #166 | Good 11.1% |
| Immigrants | Southern Europe | 54.4 /100 | #167 | Average 11.2% |
| Immigrants | Latin America | 54.0 /100 | #168 | Average 11.2% |
| Barbadians | 53.4 /100 | #169 | Average 11.2% |