Pueblo vs Immigrants from Greece Disability
COMPARE
Pueblo
Immigrants from Greece
Disability
Disability Comparison
Pueblo
Immigrants from Greece
14.4%
DISABILITY
0.0/ 100
METRIC RATING
332nd/ 347
METRIC RANK
11.3%
DISABILITY
96.9/ 100
METRIC RATING
100th/ 347
METRIC RANK
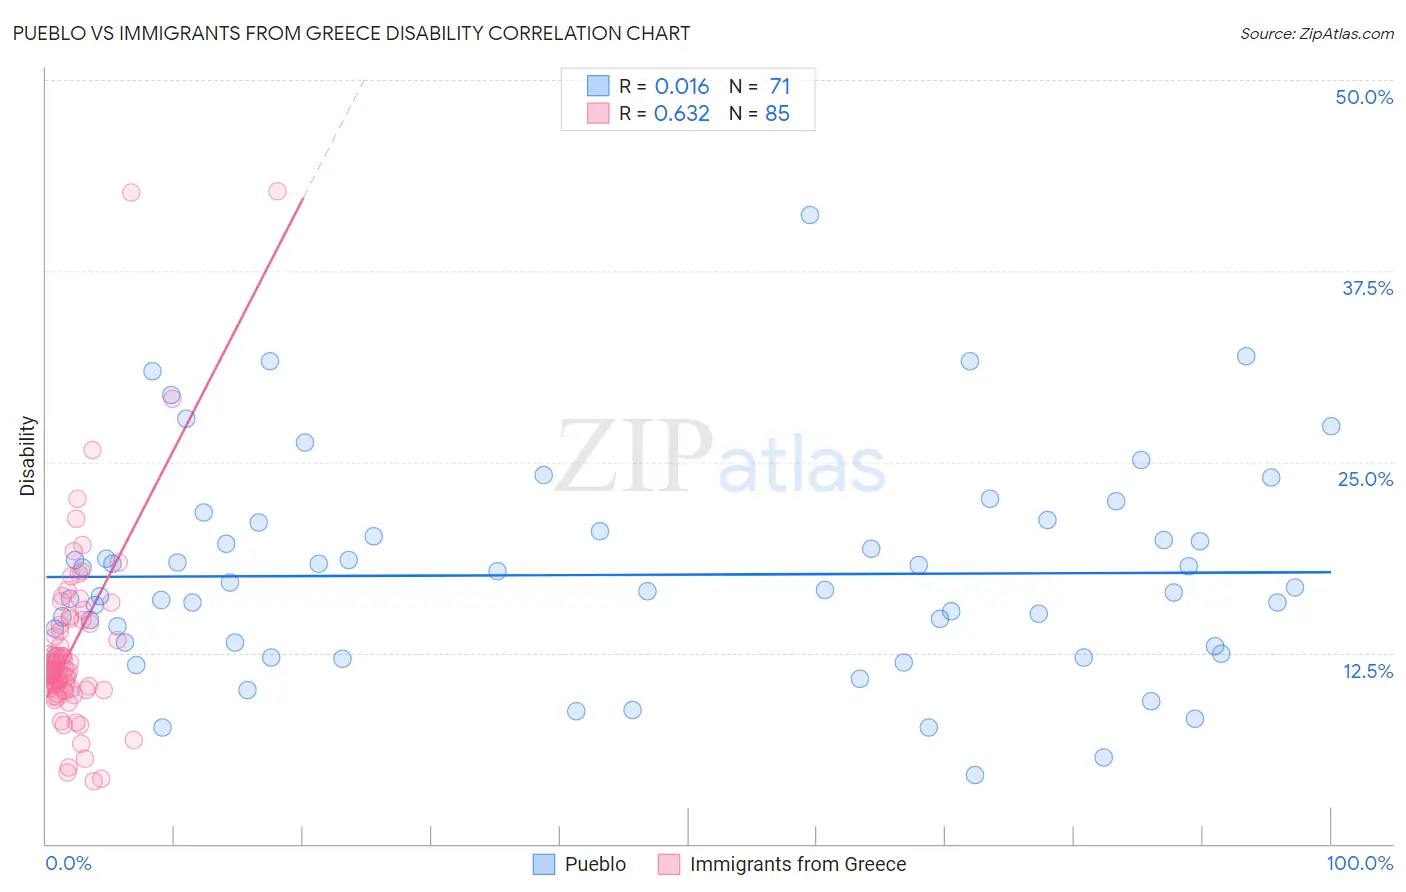
Pueblo vs Immigrants from Greece Disability Correlation Chart
The statistical analysis conducted on geographies consisting of 120,077,777 people shows no correlation between the proportion of Pueblo and percentage of population with a disability in the United States with a correlation coefficient (R) of 0.016 and weighted average of 14.4%. Similarly, the statistical analysis conducted on geographies consisting of 216,878,126 people shows a significant positive correlation between the proportion of Immigrants from Greece and percentage of population with a disability in the United States with a correlation coefficient (R) of 0.632 and weighted average of 11.3%, a difference of 28.4%.
Disability Correlation Summary
| Measurement | Pueblo | Immigrants from Greece |
| Minimum | 4.5% | 4.1% |
| Maximum | 41.2% | 42.7% |
| Range | 36.7% | 38.7% |
| Mean | 17.6% | 12.9% |
| Median | 16.6% | 11.3% |
| Interquartile 25% (IQ1) | 13.0% | 10.1% |
| Interquartile 75% (IQ3) | 20.5% | 14.5% |
| Interquartile Range (IQR) | 7.5% | 4.4% |
| Standard Deviation (Sample) | 6.9% | 6.3% |
| Standard Deviation (Population) | 6.8% | 6.3% |
Similar Demographics by Disability
Demographics Similar to Pueblo by Disability
In terms of disability, the demographic groups most similar to Pueblo are Alaskan Athabascan (14.4%, a difference of 0.020%), Cajun (14.6%, a difference of 1.1%), Yuman (14.6%, a difference of 1.2%), Navajo (14.3%, a difference of 1.3%), and Potawatomi (14.2%, a difference of 1.9%).
| Demographics | Rating | Rank | Disability |
| Natives/Alaskans | 0.0 /100 | #325 | Tragic 14.2% |
| Osage | 0.0 /100 | #326 | Tragic 14.2% |
| Ottawa | 0.0 /100 | #327 | Tragic 14.2% |
| Immigrants | Azores | 0.0 /100 | #328 | Tragic 14.2% |
| Potawatomi | 0.0 /100 | #329 | Tragic 14.2% |
| Navajo | 0.0 /100 | #330 | Tragic 14.3% |
| Alaskan Athabascans | 0.0 /100 | #331 | Tragic 14.4% |
| Pueblo | 0.0 /100 | #332 | Tragic 14.4% |
| Cajuns | 0.0 /100 | #333 | Tragic 14.6% |
| Yuman | 0.0 /100 | #334 | Tragic 14.6% |
| Tohono O'odham | 0.0 /100 | #335 | Tragic 14.8% |
| Cherokee | 0.0 /100 | #336 | Tragic 14.8% |
| Seminole | 0.0 /100 | #337 | Tragic 14.9% |
| Dutch West Indians | 0.0 /100 | #338 | Tragic 14.9% |
| Chickasaw | 0.0 /100 | #339 | Tragic 15.2% |
Demographics Similar to Immigrants from Greece by Disability
In terms of disability, the demographic groups most similar to Immigrants from Greece are Immigrants from Nicaragua (11.3%, a difference of 0.040%), Immigrants from Eastern Africa (11.3%, a difference of 0.11%), Bhutanese (11.2%, a difference of 0.18%), Uruguayan (11.2%, a difference of 0.18%), and Immigrants from Czechoslovakia (11.2%, a difference of 0.18%).
| Demographics | Rating | Rank | Disability |
| Immigrants | Ecuador | 98.0 /100 | #93 | Exceptional 11.2% |
| Immigrants | Morocco | 97.8 /100 | #94 | Exceptional 11.2% |
| Eastern Europeans | 97.8 /100 | #95 | Exceptional 11.2% |
| Immigrants | Zimbabwe | 97.7 /100 | #96 | Exceptional 11.2% |
| Bhutanese | 97.4 /100 | #97 | Exceptional 11.2% |
| Uruguayans | 97.4 /100 | #98 | Exceptional 11.2% |
| Immigrants | Czechoslovakia | 97.4 /100 | #99 | Exceptional 11.2% |
| Immigrants | Greece | 96.9 /100 | #100 | Exceptional 11.3% |
| Immigrants | Nicaragua | 96.8 /100 | #101 | Exceptional 11.3% |
| Immigrants | Eastern Africa | 96.7 /100 | #102 | Exceptional 11.3% |
| Immigrants | Uruguay | 96.4 /100 | #103 | Exceptional 11.3% |
| Immigrants | Immigrants | 96.4 /100 | #104 | Exceptional 11.3% |
| Immigrants | Kazakhstan | 96.4 /100 | #105 | Exceptional 11.3% |
| Immigrants | Eastern Europe | 96.3 /100 | #106 | Exceptional 11.3% |
| Nicaraguans | 96.2 /100 | #107 | Exceptional 11.3% |