Pueblo vs Tongan Disability
COMPARE
Pueblo
Tongan
Disability
Disability Comparison
Pueblo
Tongans
14.4%
DISABILITY
0.0/ 100
METRIC RATING
332nd/ 347
METRIC RANK
10.8%
DISABILITY
99.9/ 100
METRIC RATING
46th/ 347
METRIC RANK
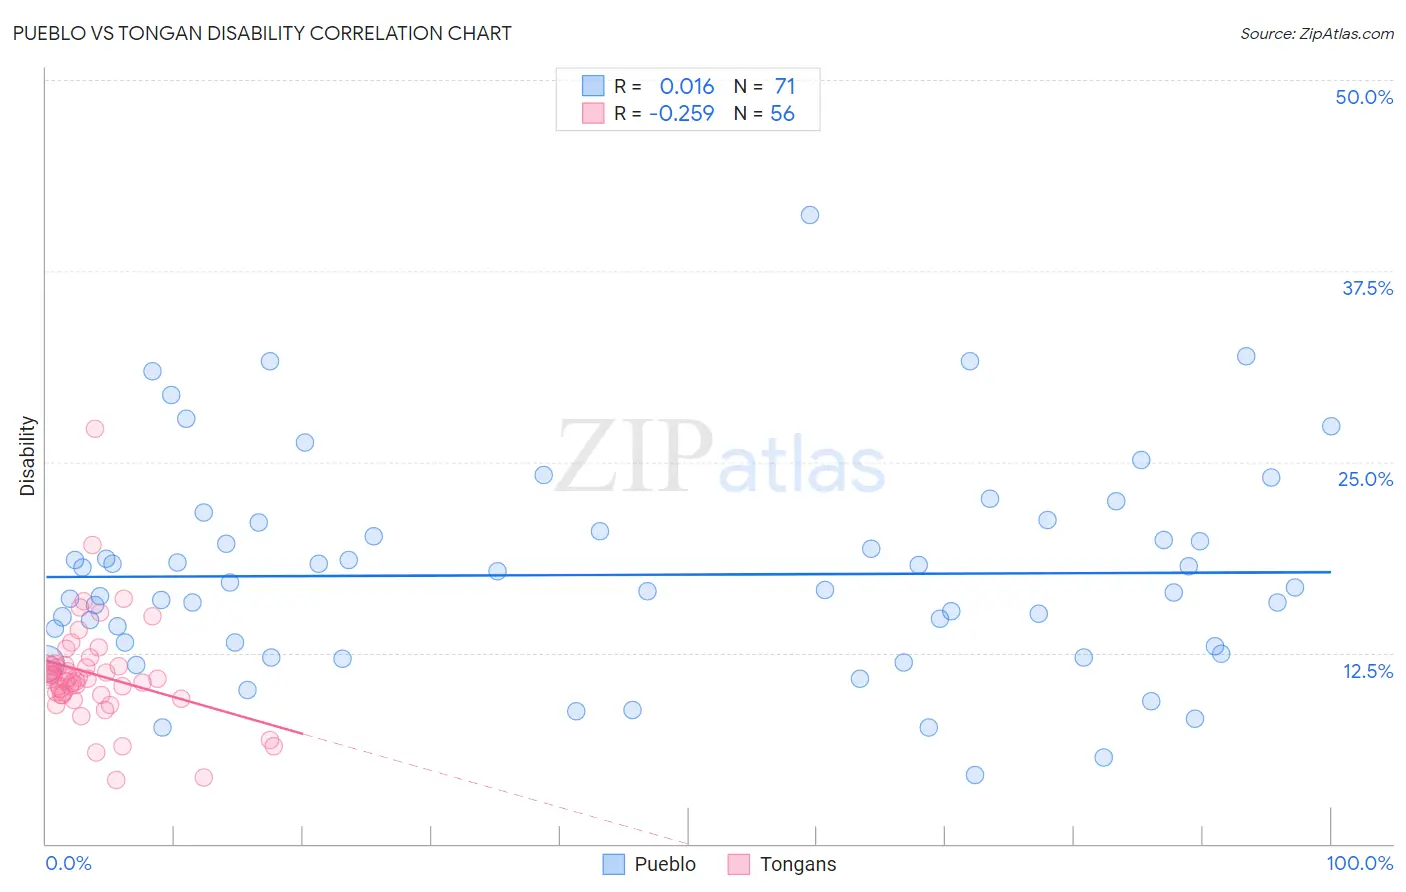
Pueblo vs Tongan Disability Correlation Chart
The statistical analysis conducted on geographies consisting of 120,077,777 people shows no correlation between the proportion of Pueblo and percentage of population with a disability in the United States with a correlation coefficient (R) of 0.016 and weighted average of 14.4%. Similarly, the statistical analysis conducted on geographies consisting of 102,894,634 people shows a weak negative correlation between the proportion of Tongans and percentage of population with a disability in the United States with a correlation coefficient (R) of -0.259 and weighted average of 10.8%, a difference of 33.4%.
Disability Correlation Summary
| Measurement | Pueblo | Tongan |
| Minimum | 4.5% | 4.2% |
| Maximum | 41.2% | 27.1% |
| Range | 36.7% | 23.0% |
| Mean | 17.6% | 11.1% |
| Median | 16.6% | 10.8% |
| Interquartile 25% (IQ1) | 13.0% | 9.8% |
| Interquartile 75% (IQ3) | 20.5% | 11.7% |
| Interquartile Range (IQR) | 7.5% | 1.9% |
| Standard Deviation (Sample) | 6.9% | 3.5% |
| Standard Deviation (Population) | 6.8% | 3.5% |
Similar Demographics by Disability
Demographics Similar to Pueblo by Disability
In terms of disability, the demographic groups most similar to Pueblo are Alaskan Athabascan (14.4%, a difference of 0.020%), Cajun (14.6%, a difference of 1.1%), Yuman (14.6%, a difference of 1.2%), Navajo (14.3%, a difference of 1.3%), and Potawatomi (14.2%, a difference of 1.9%).
| Demographics | Rating | Rank | Disability |
| Natives/Alaskans | 0.0 /100 | #325 | Tragic 14.2% |
| Osage | 0.0 /100 | #326 | Tragic 14.2% |
| Ottawa | 0.0 /100 | #327 | Tragic 14.2% |
| Immigrants | Azores | 0.0 /100 | #328 | Tragic 14.2% |
| Potawatomi | 0.0 /100 | #329 | Tragic 14.2% |
| Navajo | 0.0 /100 | #330 | Tragic 14.3% |
| Alaskan Athabascans | 0.0 /100 | #331 | Tragic 14.4% |
| Pueblo | 0.0 /100 | #332 | Tragic 14.4% |
| Cajuns | 0.0 /100 | #333 | Tragic 14.6% |
| Yuman | 0.0 /100 | #334 | Tragic 14.6% |
| Tohono O'odham | 0.0 /100 | #335 | Tragic 14.8% |
| Cherokee | 0.0 /100 | #336 | Tragic 14.8% |
| Seminole | 0.0 /100 | #337 | Tragic 14.9% |
| Dutch West Indians | 0.0 /100 | #338 | Tragic 14.9% |
| Chickasaw | 0.0 /100 | #339 | Tragic 15.2% |
Demographics Similar to Tongans by Disability
In terms of disability, the demographic groups most similar to Tongans are Immigrants from Peru (10.8%, a difference of 0.010%), Taiwanese (10.8%, a difference of 0.010%), Soviet Union (10.9%, a difference of 0.20%), Vietnamese (10.9%, a difference of 0.26%), and Immigrants from Saudi Arabia (10.9%, a difference of 0.26%).
| Demographics | Rating | Rank | Disability |
| Cambodians | 99.9 /100 | #39 | Exceptional 10.8% |
| Mongolians | 99.9 /100 | #40 | Exceptional 10.8% |
| Immigrants | Australia | 99.9 /100 | #41 | Exceptional 10.8% |
| Immigrants | Nepal | 99.9 /100 | #42 | Exceptional 10.8% |
| Israelis | 99.9 /100 | #43 | Exceptional 10.8% |
| Immigrants | Japan | 99.9 /100 | #44 | Exceptional 10.8% |
| Immigrants | Peru | 99.9 /100 | #45 | Exceptional 10.8% |
| Tongans | 99.9 /100 | #46 | Exceptional 10.8% |
| Taiwanese | 99.9 /100 | #47 | Exceptional 10.8% |
| Soviet Union | 99.9 /100 | #48 | Exceptional 10.9% |
| Vietnamese | 99.9 /100 | #49 | Exceptional 10.9% |
| Immigrants | Saudi Arabia | 99.9 /100 | #50 | Exceptional 10.9% |
| Peruvians | 99.8 /100 | #51 | Exceptional 10.9% |
| South Americans | 99.8 /100 | #52 | Exceptional 10.9% |
| Immigrants | Spain | 99.8 /100 | #53 | Exceptional 10.9% |