Pueblo vs Immigrants from Somalia Disability
COMPARE
Pueblo
Immigrants from Somalia
Disability
Disability Comparison
Pueblo
Immigrants from Somalia
14.4%
DISABILITY
0.0/ 100
METRIC RATING
332nd/ 347
METRIC RANK
12.0%
DISABILITY
6.8/ 100
METRIC RATING
214th/ 347
METRIC RANK
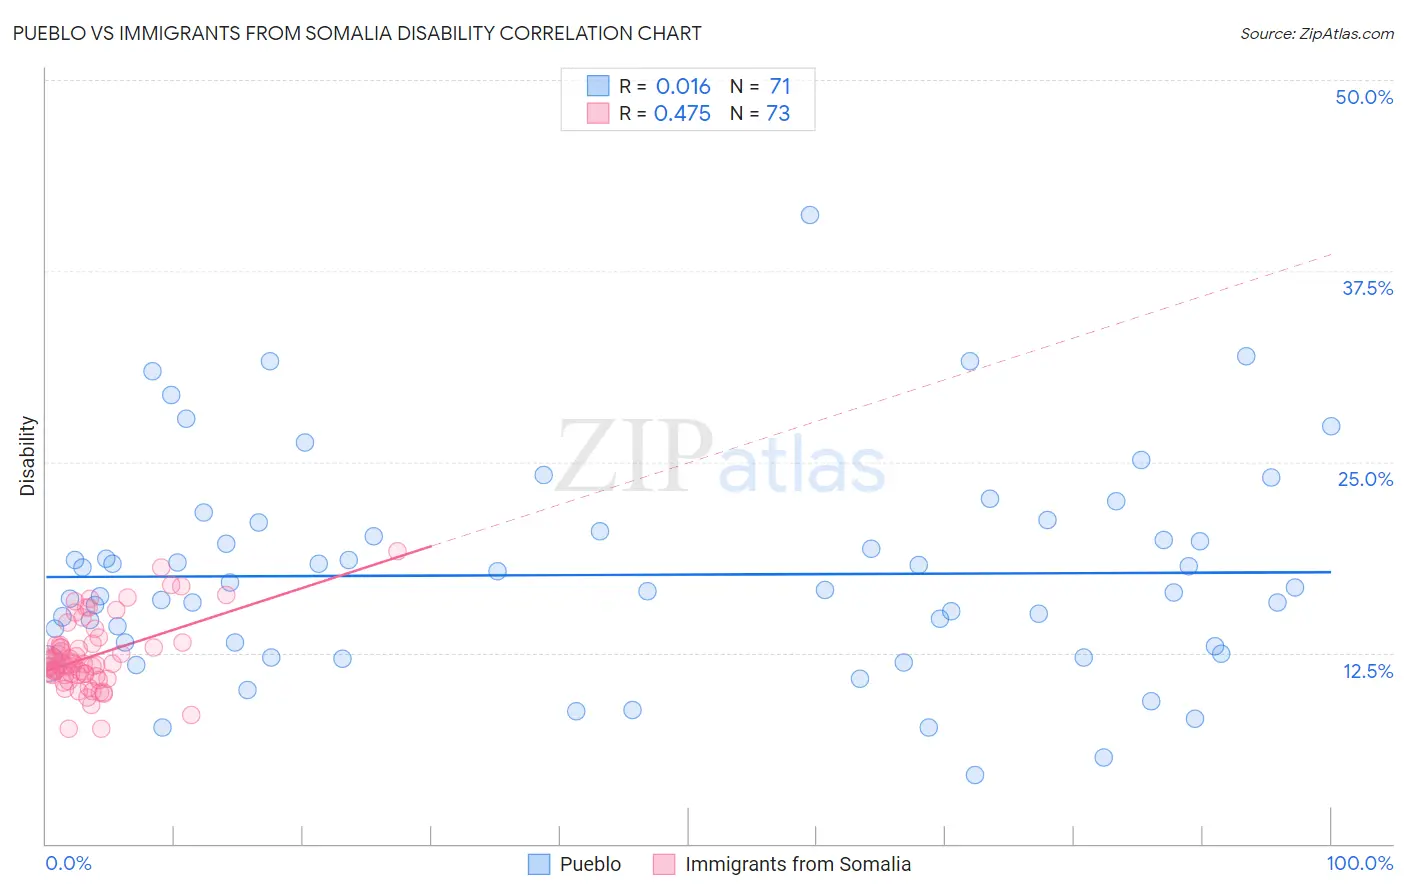
Pueblo vs Immigrants from Somalia Disability Correlation Chart
The statistical analysis conducted on geographies consisting of 120,077,777 people shows no correlation between the proportion of Pueblo and percentage of population with a disability in the United States with a correlation coefficient (R) of 0.016 and weighted average of 14.4%. Similarly, the statistical analysis conducted on geographies consisting of 92,105,363 people shows a moderate positive correlation between the proportion of Immigrants from Somalia and percentage of population with a disability in the United States with a correlation coefficient (R) of 0.475 and weighted average of 12.0%, a difference of 20.0%.
Disability Correlation Summary
| Measurement | Pueblo | Immigrants from Somalia |
| Minimum | 4.5% | 7.5% |
| Maximum | 41.2% | 19.1% |
| Range | 36.7% | 11.6% |
| Mean | 17.6% | 12.3% |
| Median | 16.6% | 11.8% |
| Interquartile 25% (IQ1) | 13.0% | 11.1% |
| Interquartile 75% (IQ3) | 20.5% | 13.1% |
| Interquartile Range (IQR) | 7.5% | 2.0% |
| Standard Deviation (Sample) | 6.9% | 2.3% |
| Standard Deviation (Population) | 6.8% | 2.3% |
Similar Demographics by Disability
Demographics Similar to Pueblo by Disability
In terms of disability, the demographic groups most similar to Pueblo are Alaskan Athabascan (14.4%, a difference of 0.020%), Cajun (14.6%, a difference of 1.1%), Yuman (14.6%, a difference of 1.2%), Navajo (14.3%, a difference of 1.3%), and Potawatomi (14.2%, a difference of 1.9%).
| Demographics | Rating | Rank | Disability |
| Natives/Alaskans | 0.0 /100 | #325 | Tragic 14.2% |
| Osage | 0.0 /100 | #326 | Tragic 14.2% |
| Ottawa | 0.0 /100 | #327 | Tragic 14.2% |
| Immigrants | Azores | 0.0 /100 | #328 | Tragic 14.2% |
| Potawatomi | 0.0 /100 | #329 | Tragic 14.2% |
| Navajo | 0.0 /100 | #330 | Tragic 14.3% |
| Alaskan Athabascans | 0.0 /100 | #331 | Tragic 14.4% |
| Pueblo | 0.0 /100 | #332 | Tragic 14.4% |
| Cajuns | 0.0 /100 | #333 | Tragic 14.6% |
| Yuman | 0.0 /100 | #334 | Tragic 14.6% |
| Tohono O'odham | 0.0 /100 | #335 | Tragic 14.8% |
| Cherokee | 0.0 /100 | #336 | Tragic 14.8% |
| Seminole | 0.0 /100 | #337 | Tragic 14.9% |
| Dutch West Indians | 0.0 /100 | #338 | Tragic 14.9% |
| Chickasaw | 0.0 /100 | #339 | Tragic 15.2% |
Demographics Similar to Immigrants from Somalia by Disability
In terms of disability, the demographic groups most similar to Immigrants from Somalia are Immigrants from Iraq (12.0%, a difference of 0.050%), Austrian (12.0%, a difference of 0.060%), Immigrants from Cambodia (12.0%, a difference of 0.080%), Immigrants from Canada (12.1%, a difference of 0.13%), and Czech (12.0%, a difference of 0.16%).
| Demographics | Rating | Rank | Disability |
| Immigrants | Thailand | 9.3 /100 | #207 | Tragic 12.0% |
| Immigrants | Caribbean | 9.1 /100 | #208 | Tragic 12.0% |
| Danes | 8.7 /100 | #209 | Tragic 12.0% |
| Czechs | 7.9 /100 | #210 | Tragic 12.0% |
| Immigrants | Cambodia | 7.3 /100 | #211 | Tragic 12.0% |
| Austrians | 7.2 /100 | #212 | Tragic 12.0% |
| Immigrants | Iraq | 7.1 /100 | #213 | Tragic 12.0% |
| Immigrants | Somalia | 6.8 /100 | #214 | Tragic 12.0% |
| Immigrants | Canada | 6.1 /100 | #215 | Tragic 12.1% |
| Panamanians | 5.4 /100 | #216 | Tragic 12.1% |
| Immigrants | North America | 5.3 /100 | #217 | Tragic 12.1% |
| Immigrants | Jamaica | 5.0 /100 | #218 | Tragic 12.1% |
| Croatians | 4.9 /100 | #219 | Tragic 12.1% |
| Immigrants | Bahamas | 4.7 /100 | #220 | Tragic 12.1% |
| Northern Europeans | 4.2 /100 | #221 | Tragic 12.1% |