Pima vs Slavic Male Disability
COMPARE
Pima
Slavic
Male Disability
Male Disability Comparison
Pima
Slavs
12.8%
MALE DISABILITY
0.0/ 100
METRIC RATING
290th/ 347
METRIC RANK
12.2%
MALE DISABILITY
0.2/ 100
METRIC RATING
261st/ 347
METRIC RANK
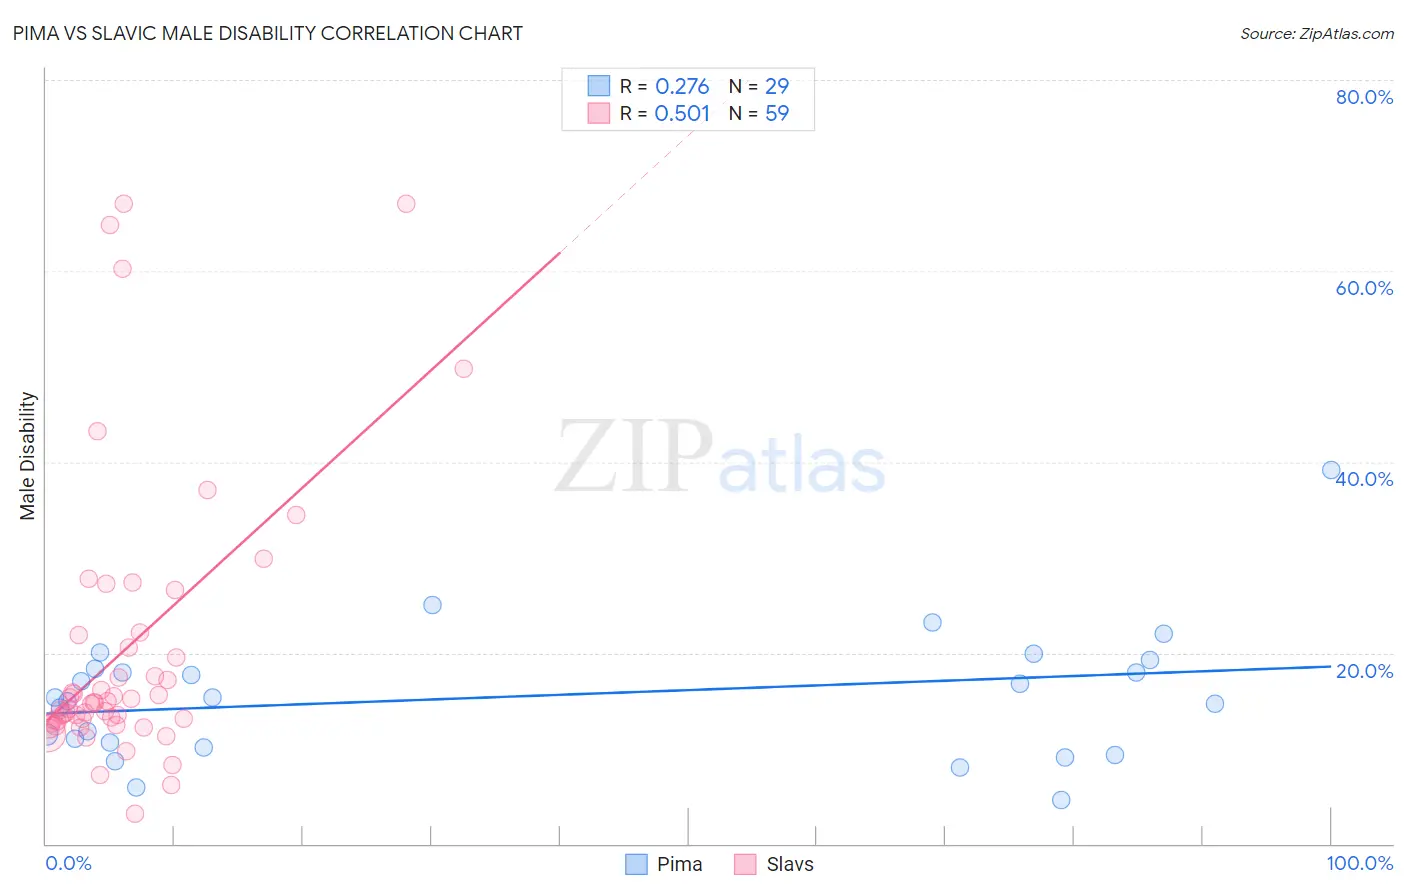
Pima vs Slavic Male Disability Correlation Chart
The statistical analysis conducted on geographies consisting of 61,540,793 people shows a weak positive correlation between the proportion of Pima and percentage of males with a disability in the United States with a correlation coefficient (R) of 0.276 and weighted average of 12.8%. Similarly, the statistical analysis conducted on geographies consisting of 270,856,634 people shows a substantial positive correlation between the proportion of Slavs and percentage of males with a disability in the United States with a correlation coefficient (R) of 0.501 and weighted average of 12.2%, a difference of 5.4%.
Male Disability Correlation Summary
| Measurement | Pima | Slavic |
| Minimum | 4.5% | 3.2% |
| Maximum | 39.1% | 67.0% |
| Range | 34.6% | 63.9% |
| Mean | 15.5% | 20.3% |
| Median | 15.3% | 14.8% |
| Interquartile 25% (IQ1) | 10.3% | 12.8% |
| Interquartile 75% (IQ3) | 18.8% | 21.9% |
| Interquartile Range (IQR) | 8.5% | 9.1% |
| Standard Deviation (Sample) | 6.9% | 14.7% |
| Standard Deviation (Population) | 6.8% | 14.6% |
Similar Demographics by Male Disability
Demographics Similar to Pima by Male Disability
In terms of male disability, the demographic groups most similar to Pima are White/Caucasian (12.8%, a difference of 0.090%), Immigrants from Cabo Verde (12.8%, a difference of 0.15%), English (12.8%, a difference of 0.15%), Yup'ik (12.8%, a difference of 0.34%), and Yaqui (12.9%, a difference of 0.44%).
| Demographics | Rating | Rank | Male Disability |
| Germans | 0.0 /100 | #283 | Tragic 12.7% |
| Spanish | 0.0 /100 | #284 | Tragic 12.7% |
| Welsh | 0.0 /100 | #285 | Tragic 12.7% |
| Scottish | 0.0 /100 | #286 | Tragic 12.8% |
| Cape Verdeans | 0.0 /100 | #287 | Tragic 12.8% |
| Yup'ik | 0.0 /100 | #288 | Tragic 12.8% |
| Immigrants | Cabo Verde | 0.0 /100 | #289 | Tragic 12.8% |
| Pima | 0.0 /100 | #290 | Tragic 12.8% |
| Whites/Caucasians | 0.0 /100 | #291 | Tragic 12.8% |
| English | 0.0 /100 | #292 | Tragic 12.8% |
| Yaqui | 0.0 /100 | #293 | Tragic 12.9% |
| Marshallese | 0.0 /100 | #294 | Tragic 12.9% |
| Immigrants | Micronesia | 0.0 /100 | #295 | Tragic 12.9% |
| Immigrants | Nonimmigrants | 0.0 /100 | #296 | Tragic 12.9% |
| Inupiat | 0.0 /100 | #297 | Tragic 13.0% |
Demographics Similar to Slavs by Male Disability
In terms of male disability, the demographic groups most similar to Slavs are Norwegian (12.2%, a difference of 0.010%), Canadian (12.2%, a difference of 0.21%), Nepalese (12.2%, a difference of 0.25%), Swedish (12.1%, a difference of 0.36%), and Belgian (12.1%, a difference of 0.43%).
| Demographics | Rating | Rank | Male Disability |
| British | 0.4 /100 | #254 | Tragic 12.1% |
| Chinese | 0.4 /100 | #255 | Tragic 12.1% |
| Swiss | 0.3 /100 | #256 | Tragic 12.1% |
| Europeans | 0.3 /100 | #257 | Tragic 12.1% |
| Basques | 0.3 /100 | #258 | Tragic 12.1% |
| Belgians | 0.3 /100 | #259 | Tragic 12.1% |
| Swedes | 0.3 /100 | #260 | Tragic 12.1% |
| Slavs | 0.2 /100 | #261 | Tragic 12.2% |
| Norwegians | 0.2 /100 | #262 | Tragic 12.2% |
| Canadians | 0.2 /100 | #263 | Tragic 12.2% |
| Nepalese | 0.2 /100 | #264 | Tragic 12.2% |
| Immigrants | Portugal | 0.1 /100 | #265 | Tragic 12.3% |
| Hawaiians | 0.1 /100 | #266 | Tragic 12.3% |
| Immigrants | Germany | 0.1 /100 | #267 | Tragic 12.3% |
| Portuguese | 0.1 /100 | #268 | Tragic 12.3% |