Pima vs Immigrants from Oceania Female Disability
COMPARE
Pima
Immigrants from Oceania
Female Disability
Female Disability Comparison
Pima
Immigrants from Oceania
14.8%
FEMALE DISABILITY
0.0/ 100
METRIC RATING
332nd/ 347
METRIC RANK
12.1%
FEMALE DISABILITY
61.8/ 100
METRIC RATING
165th/ 347
METRIC RANK
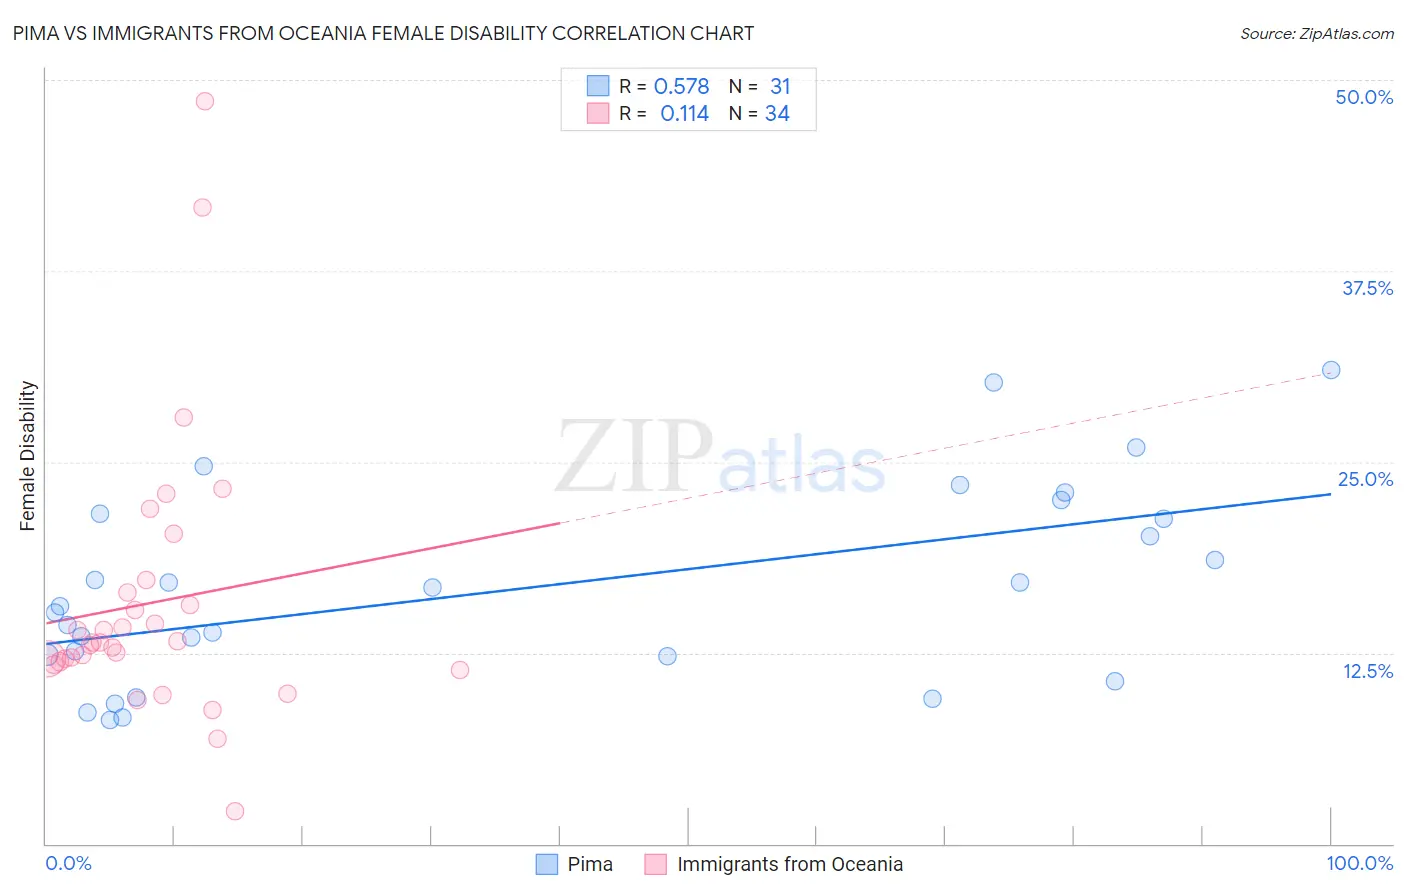
Pima vs Immigrants from Oceania Female Disability Correlation Chart
The statistical analysis conducted on geographies consisting of 61,537,754 people shows a substantial positive correlation between the proportion of Pima and percentage of females with a disability in the United States with a correlation coefficient (R) of 0.578 and weighted average of 14.8%. Similarly, the statistical analysis conducted on geographies consisting of 305,480,731 people shows a poor positive correlation between the proportion of Immigrants from Oceania and percentage of females with a disability in the United States with a correlation coefficient (R) of 0.114 and weighted average of 12.1%, a difference of 21.9%.
Female Disability Correlation Summary
| Measurement | Pima | Immigrants from Oceania |
| Minimum | 8.1% | 2.2% |
| Maximum | 31.0% | 48.6% |
| Range | 22.9% | 46.4% |
| Mean | 16.7% | 15.8% |
| Median | 15.6% | 13.2% |
| Interquartile 25% (IQ1) | 12.3% | 11.9% |
| Interquartile 75% (IQ3) | 21.6% | 16.4% |
| Interquartile Range (IQR) | 9.3% | 4.5% |
| Standard Deviation (Sample) | 6.4% | 9.0% |
| Standard Deviation (Population) | 6.3% | 8.8% |
Similar Demographics by Female Disability
Demographics Similar to Pima by Female Disability
In terms of female disability, the demographic groups most similar to Pima are Immigrants from the Azores (14.9%, a difference of 0.39%), Cherokee (14.9%, a difference of 0.48%), Cajun (14.9%, a difference of 0.50%), Seminole (15.0%, a difference of 1.2%), and Tohono O'odham (15.0%, a difference of 1.3%).
| Demographics | Rating | Rank | Female Disability |
| Navajo | 0.0 /100 | #325 | Tragic 14.2% |
| Comanche | 0.0 /100 | #326 | Tragic 14.2% |
| Ottawa | 0.0 /100 | #327 | Tragic 14.2% |
| Cape Verdeans | 0.0 /100 | #328 | Tragic 14.2% |
| Osage | 0.0 /100 | #329 | Tragic 14.3% |
| Yuman | 0.0 /100 | #330 | Tragic 14.5% |
| Immigrants | Cabo Verde | 0.0 /100 | #331 | Tragic 14.6% |
| Pima | 0.0 /100 | #332 | Tragic 14.8% |
| Immigrants | Azores | 0.0 /100 | #333 | Tragic 14.9% |
| Cherokee | 0.0 /100 | #334 | Tragic 14.9% |
| Cajuns | 0.0 /100 | #335 | Tragic 14.9% |
| Seminole | 0.0 /100 | #336 | Tragic 15.0% |
| Tohono O'odham | 0.0 /100 | #337 | Tragic 15.0% |
| Dutch West Indians | 0.0 /100 | #338 | Tragic 15.0% |
| Colville | 0.0 /100 | #339 | Tragic 15.1% |
Demographics Similar to Immigrants from Oceania by Female Disability
In terms of female disability, the demographic groups most similar to Immigrants from Oceania are Czech (12.1%, a difference of 0.070%), Guatemalan (12.1%, a difference of 0.080%), Lithuanian (12.2%, a difference of 0.090%), Immigrants from Ukraine (12.1%, a difference of 0.10%), and Guyanese (12.1%, a difference of 0.11%).
| Demographics | Rating | Rank | Female Disability |
| Immigrants | Middle Africa | 72.4 /100 | #158 | Good 12.1% |
| Immigrants | Central America | 67.7 /100 | #159 | Good 12.1% |
| Immigrants | Guatemala | 66.0 /100 | #160 | Good 12.1% |
| Guyanese | 64.7 /100 | #161 | Good 12.1% |
| Immigrants | Ukraine | 64.3 /100 | #162 | Good 12.1% |
| Guatemalans | 63.8 /100 | #163 | Good 12.1% |
| Czechs | 63.6 /100 | #164 | Good 12.1% |
| Immigrants | Oceania | 61.8 /100 | #165 | Good 12.1% |
| Lithuanians | 59.5 /100 | #166 | Average 12.2% |
| Immigrants | Latin America | 59.0 /100 | #167 | Average 12.2% |
| Immigrants | Haiti | 58.8 /100 | #168 | Average 12.2% |
| Lebanese | 58.1 /100 | #169 | Average 12.2% |
| Maltese | 57.0 /100 | #170 | Average 12.2% |
| Immigrants | Southern Europe | 56.3 /100 | #171 | Average 12.2% |
| Haitians | 51.9 /100 | #172 | Average 12.2% |