Pima vs Sri Lankan Female Disability
COMPARE
Pima
Sri Lankan
Female Disability
Female Disability Comparison
Pima
Sri Lankans
14.8%
FEMALE DISABILITY
0.0/ 100
METRIC RATING
332nd/ 347
METRIC RANK
11.4%
FEMALE DISABILITY
99.9/ 100
METRIC RATING
62nd/ 347
METRIC RANK
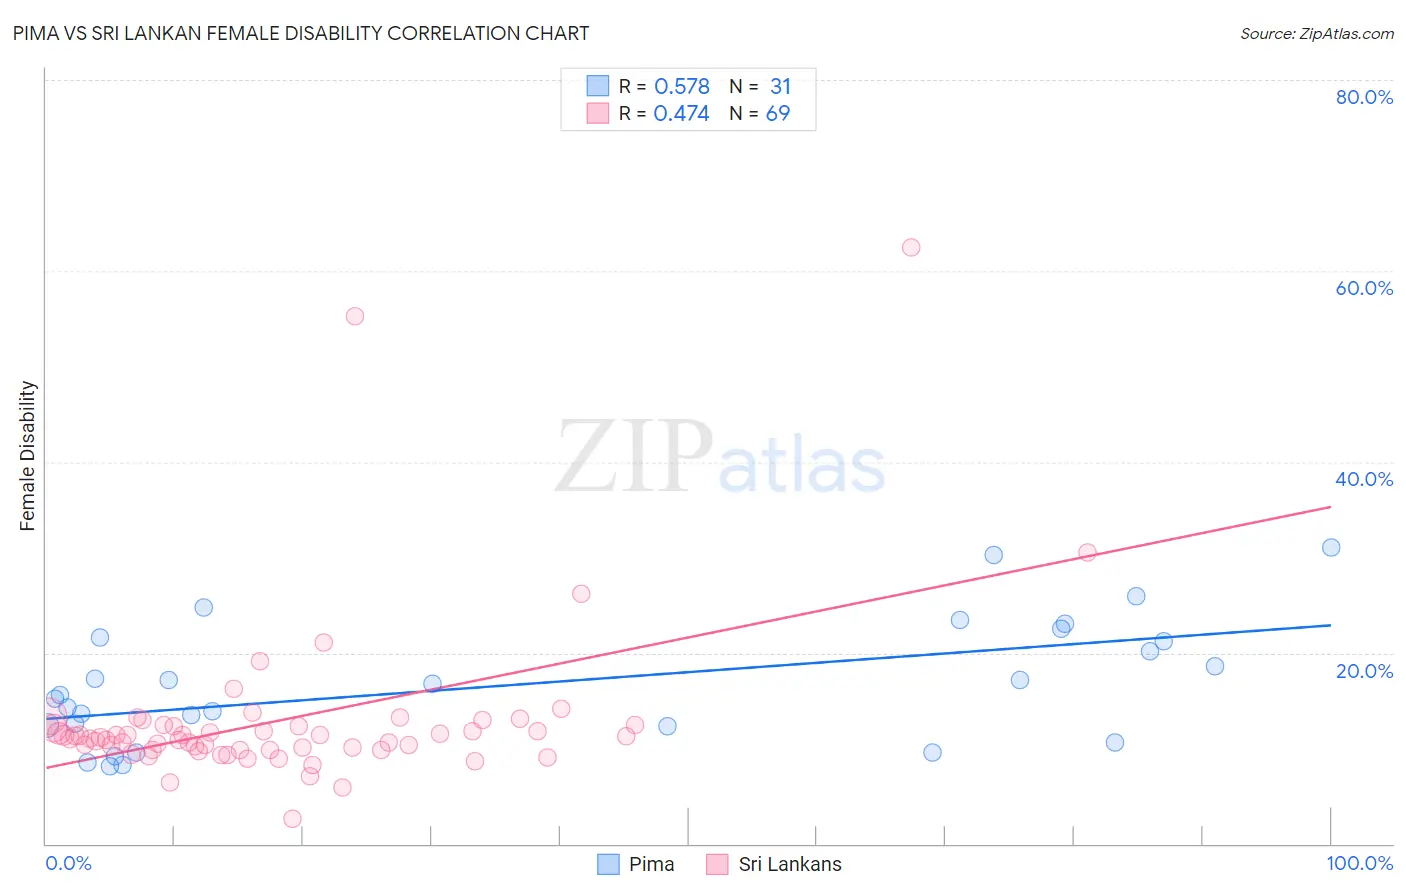
Pima vs Sri Lankan Female Disability Correlation Chart
The statistical analysis conducted on geographies consisting of 61,537,754 people shows a substantial positive correlation between the proportion of Pima and percentage of females with a disability in the United States with a correlation coefficient (R) of 0.578 and weighted average of 14.8%. Similarly, the statistical analysis conducted on geographies consisting of 440,479,567 people shows a moderate positive correlation between the proportion of Sri Lankans and percentage of females with a disability in the United States with a correlation coefficient (R) of 0.474 and weighted average of 11.4%, a difference of 29.5%.
Female Disability Correlation Summary
| Measurement | Pima | Sri Lankan |
| Minimum | 8.1% | 2.6% |
| Maximum | 31.0% | 62.5% |
| Range | 22.9% | 59.9% |
| Mean | 16.7% | 12.9% |
| Median | 15.6% | 11.2% |
| Interquartile 25% (IQ1) | 12.3% | 9.8% |
| Interquartile 75% (IQ3) | 21.6% | 12.4% |
| Interquartile Range (IQR) | 9.3% | 2.5% |
| Standard Deviation (Sample) | 6.4% | 8.9% |
| Standard Deviation (Population) | 6.3% | 8.9% |
Similar Demographics by Female Disability
Demographics Similar to Pima by Female Disability
In terms of female disability, the demographic groups most similar to Pima are Immigrants from the Azores (14.9%, a difference of 0.39%), Cherokee (14.9%, a difference of 0.48%), Cajun (14.9%, a difference of 0.50%), Seminole (15.0%, a difference of 1.2%), and Tohono O'odham (15.0%, a difference of 1.3%).
| Demographics | Rating | Rank | Female Disability |
| Navajo | 0.0 /100 | #325 | Tragic 14.2% |
| Comanche | 0.0 /100 | #326 | Tragic 14.2% |
| Ottawa | 0.0 /100 | #327 | Tragic 14.2% |
| Cape Verdeans | 0.0 /100 | #328 | Tragic 14.2% |
| Osage | 0.0 /100 | #329 | Tragic 14.3% |
| Yuman | 0.0 /100 | #330 | Tragic 14.5% |
| Immigrants | Cabo Verde | 0.0 /100 | #331 | Tragic 14.6% |
| Pima | 0.0 /100 | #332 | Tragic 14.8% |
| Immigrants | Azores | 0.0 /100 | #333 | Tragic 14.9% |
| Cherokee | 0.0 /100 | #334 | Tragic 14.9% |
| Cajuns | 0.0 /100 | #335 | Tragic 14.9% |
| Seminole | 0.0 /100 | #336 | Tragic 15.0% |
| Tohono O'odham | 0.0 /100 | #337 | Tragic 15.0% |
| Dutch West Indians | 0.0 /100 | #338 | Tragic 15.0% |
| Colville | 0.0 /100 | #339 | Tragic 15.1% |
Demographics Similar to Sri Lankans by Female Disability
In terms of female disability, the demographic groups most similar to Sri Lankans are Immigrants from France (11.4%, a difference of 0.10%), Immigrants from Colombia (11.4%, a difference of 0.10%), Immigrants from Bulgaria (11.4%, a difference of 0.15%), Immigrants from El Salvador (11.4%, a difference of 0.17%), and Immigrants from South America (11.4%, a difference of 0.19%).
| Demographics | Rating | Rank | Female Disability |
| Bulgarians | 99.9 /100 | #55 | Exceptional 11.3% |
| Taiwanese | 99.9 /100 | #56 | Exceptional 11.4% |
| South Americans | 99.9 /100 | #57 | Exceptional 11.4% |
| Laotians | 99.9 /100 | #58 | Exceptional 11.4% |
| Immigrants | Spain | 99.9 /100 | #59 | Exceptional 11.4% |
| Immigrants | Bulgaria | 99.9 /100 | #60 | Exceptional 11.4% |
| Immigrants | France | 99.9 /100 | #61 | Exceptional 11.4% |
| Sri Lankans | 99.9 /100 | #62 | Exceptional 11.4% |
| Immigrants | Colombia | 99.9 /100 | #63 | Exceptional 11.4% |
| Immigrants | El Salvador | 99.9 /100 | #64 | Exceptional 11.4% |
| Immigrants | South America | 99.9 /100 | #65 | Exceptional 11.4% |
| Salvadorans | 99.8 /100 | #66 | Exceptional 11.5% |
| Immigrants | Vietnam | 99.8 /100 | #67 | Exceptional 11.5% |
| Immigrants | Northern Africa | 99.8 /100 | #68 | Exceptional 11.5% |
| Colombians | 99.8 /100 | #69 | Exceptional 11.5% |