Peruvian vs Delaware Female Disability
COMPARE
Peruvian
Delaware
Female Disability
Female Disability Comparison
Peruvians
Delaware
11.3%
FEMALE DISABILITY
99.9/ 100
METRIC RATING
54th/ 347
METRIC RANK
13.8%
FEMALE DISABILITY
0.0/ 100
METRIC RATING
312th/ 347
METRIC RANK
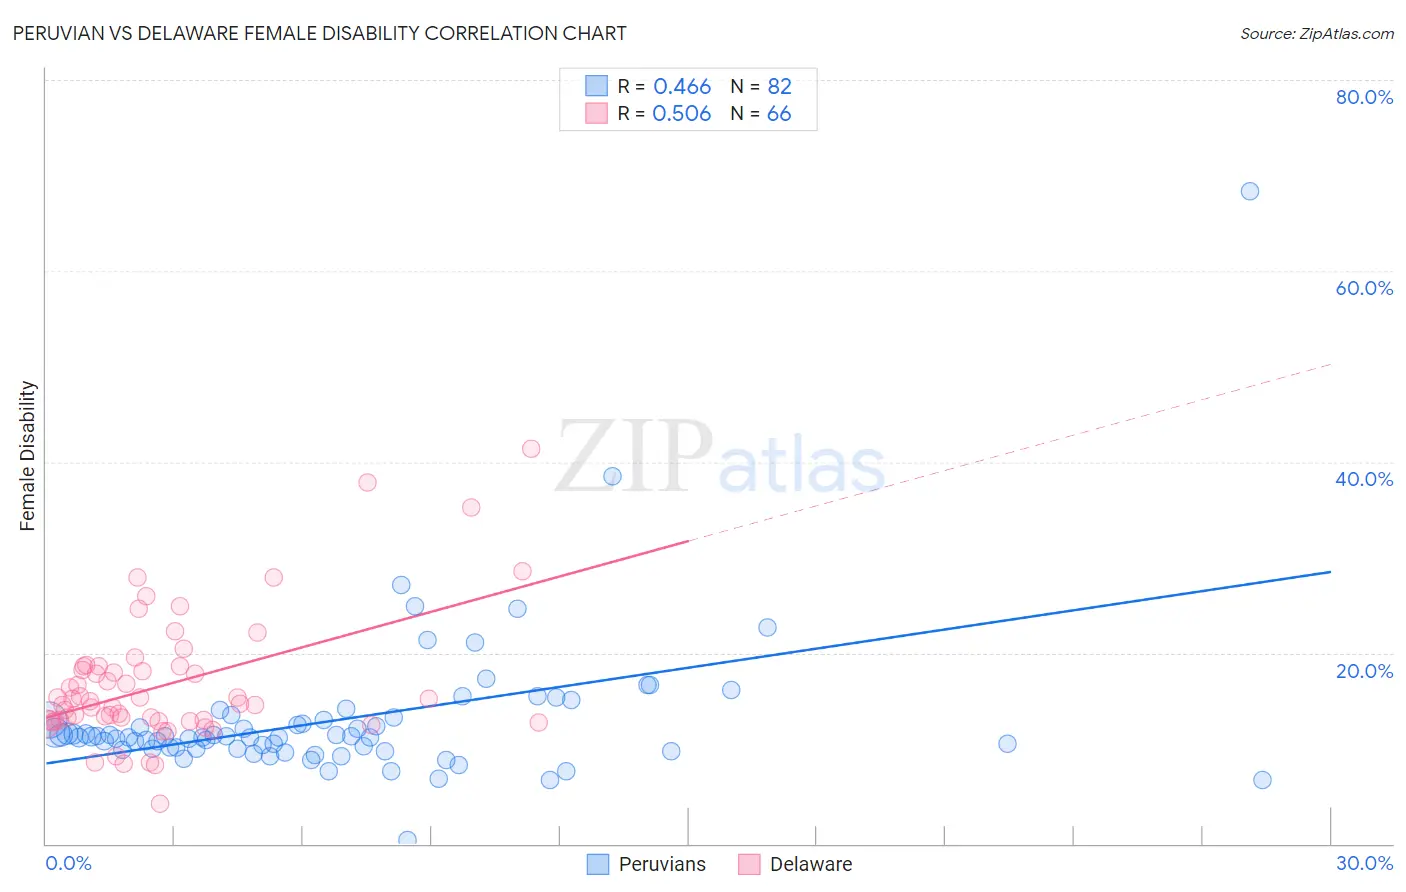
Peruvian vs Delaware Female Disability Correlation Chart
The statistical analysis conducted on geographies consisting of 363,181,047 people shows a moderate positive correlation between the proportion of Peruvians and percentage of females with a disability in the United States with a correlation coefficient (R) of 0.466 and weighted average of 11.3%. Similarly, the statistical analysis conducted on geographies consisting of 96,239,773 people shows a substantial positive correlation between the proportion of Delaware and percentage of females with a disability in the United States with a correlation coefficient (R) of 0.506 and weighted average of 13.8%, a difference of 21.7%.
Female Disability Correlation Summary
| Measurement | Peruvian | Delaware |
| Minimum | 0.45% | 4.2% |
| Maximum | 68.3% | 41.4% |
| Range | 67.8% | 37.2% |
| Mean | 13.0% | 16.6% |
| Median | 11.2% | 14.8% |
| Interquartile 25% (IQ1) | 9.9% | 12.8% |
| Interquartile 75% (IQ3) | 13.0% | 18.5% |
| Interquartile Range (IQR) | 3.1% | 5.7% |
| Standard Deviation (Sample) | 8.0% | 6.8% |
| Standard Deviation (Population) | 8.0% | 6.7% |
Similar Demographics by Female Disability
Demographics Similar to Peruvians by Female Disability
In terms of female disability, the demographic groups most similar to Peruvians are Bulgarian (11.3%, a difference of 0.020%), Immigrants from Saudi Arabia (11.3%, a difference of 0.060%), Immigrants from Peru (11.3%, a difference of 0.10%), Immigrants from Belgium (11.3%, a difference of 0.22%), and Taiwanese (11.4%, a difference of 0.25%).
| Demographics | Rating | Rank | Female Disability |
| Jordanians | 100.0 /100 | #47 | Exceptional 11.3% |
| Zimbabweans | 100.0 /100 | #48 | Exceptional 11.3% |
| Tongans | 100.0 /100 | #49 | Exceptional 11.3% |
| Inupiat | 100.0 /100 | #50 | Exceptional 11.3% |
| Immigrants | Belgium | 100.0 /100 | #51 | Exceptional 11.3% |
| Immigrants | Peru | 99.9 /100 | #52 | Exceptional 11.3% |
| Immigrants | Saudi Arabia | 99.9 /100 | #53 | Exceptional 11.3% |
| Peruvians | 99.9 /100 | #54 | Exceptional 11.3% |
| Bulgarians | 99.9 /100 | #55 | Exceptional 11.3% |
| Taiwanese | 99.9 /100 | #56 | Exceptional 11.4% |
| South Americans | 99.9 /100 | #57 | Exceptional 11.4% |
| Laotians | 99.9 /100 | #58 | Exceptional 11.4% |
| Immigrants | Spain | 99.9 /100 | #59 | Exceptional 11.4% |
| Immigrants | Bulgaria | 99.9 /100 | #60 | Exceptional 11.4% |
| Immigrants | France | 99.9 /100 | #61 | Exceptional 11.4% |
Demographics Similar to Delaware by Female Disability
In terms of female disability, the demographic groups most similar to Delaware are Hopi (13.7%, a difference of 0.31%), Blackfeet (13.8%, a difference of 0.32%), Puget Sound Salish (13.8%, a difference of 0.42%), Apache (13.7%, a difference of 0.60%), and French American Indian (13.7%, a difference of 0.72%).
| Demographics | Rating | Rank | Female Disability |
| Dominicans | 0.0 /100 | #305 | Tragic 13.5% |
| French Canadians | 0.0 /100 | #306 | Tragic 13.6% |
| Central American Indians | 0.0 /100 | #307 | Tragic 13.6% |
| Cree | 0.0 /100 | #308 | Tragic 13.7% |
| French American Indians | 0.0 /100 | #309 | Tragic 13.7% |
| Apache | 0.0 /100 | #310 | Tragic 13.7% |
| Hopi | 0.0 /100 | #311 | Tragic 13.7% |
| Delaware | 0.0 /100 | #312 | Tragic 13.8% |
| Blackfeet | 0.0 /100 | #313 | Tragic 13.8% |
| Puget Sound Salish | 0.0 /100 | #314 | Tragic 13.8% |
| Alaskan Athabascans | 0.0 /100 | #315 | Tragic 13.9% |
| Spanish Americans | 0.0 /100 | #316 | Tragic 14.0% |
| Chippewa | 0.0 /100 | #317 | Tragic 14.0% |
| Paiute | 0.0 /100 | #318 | Tragic 14.0% |
| Iroquois | 0.0 /100 | #319 | Tragic 14.0% |